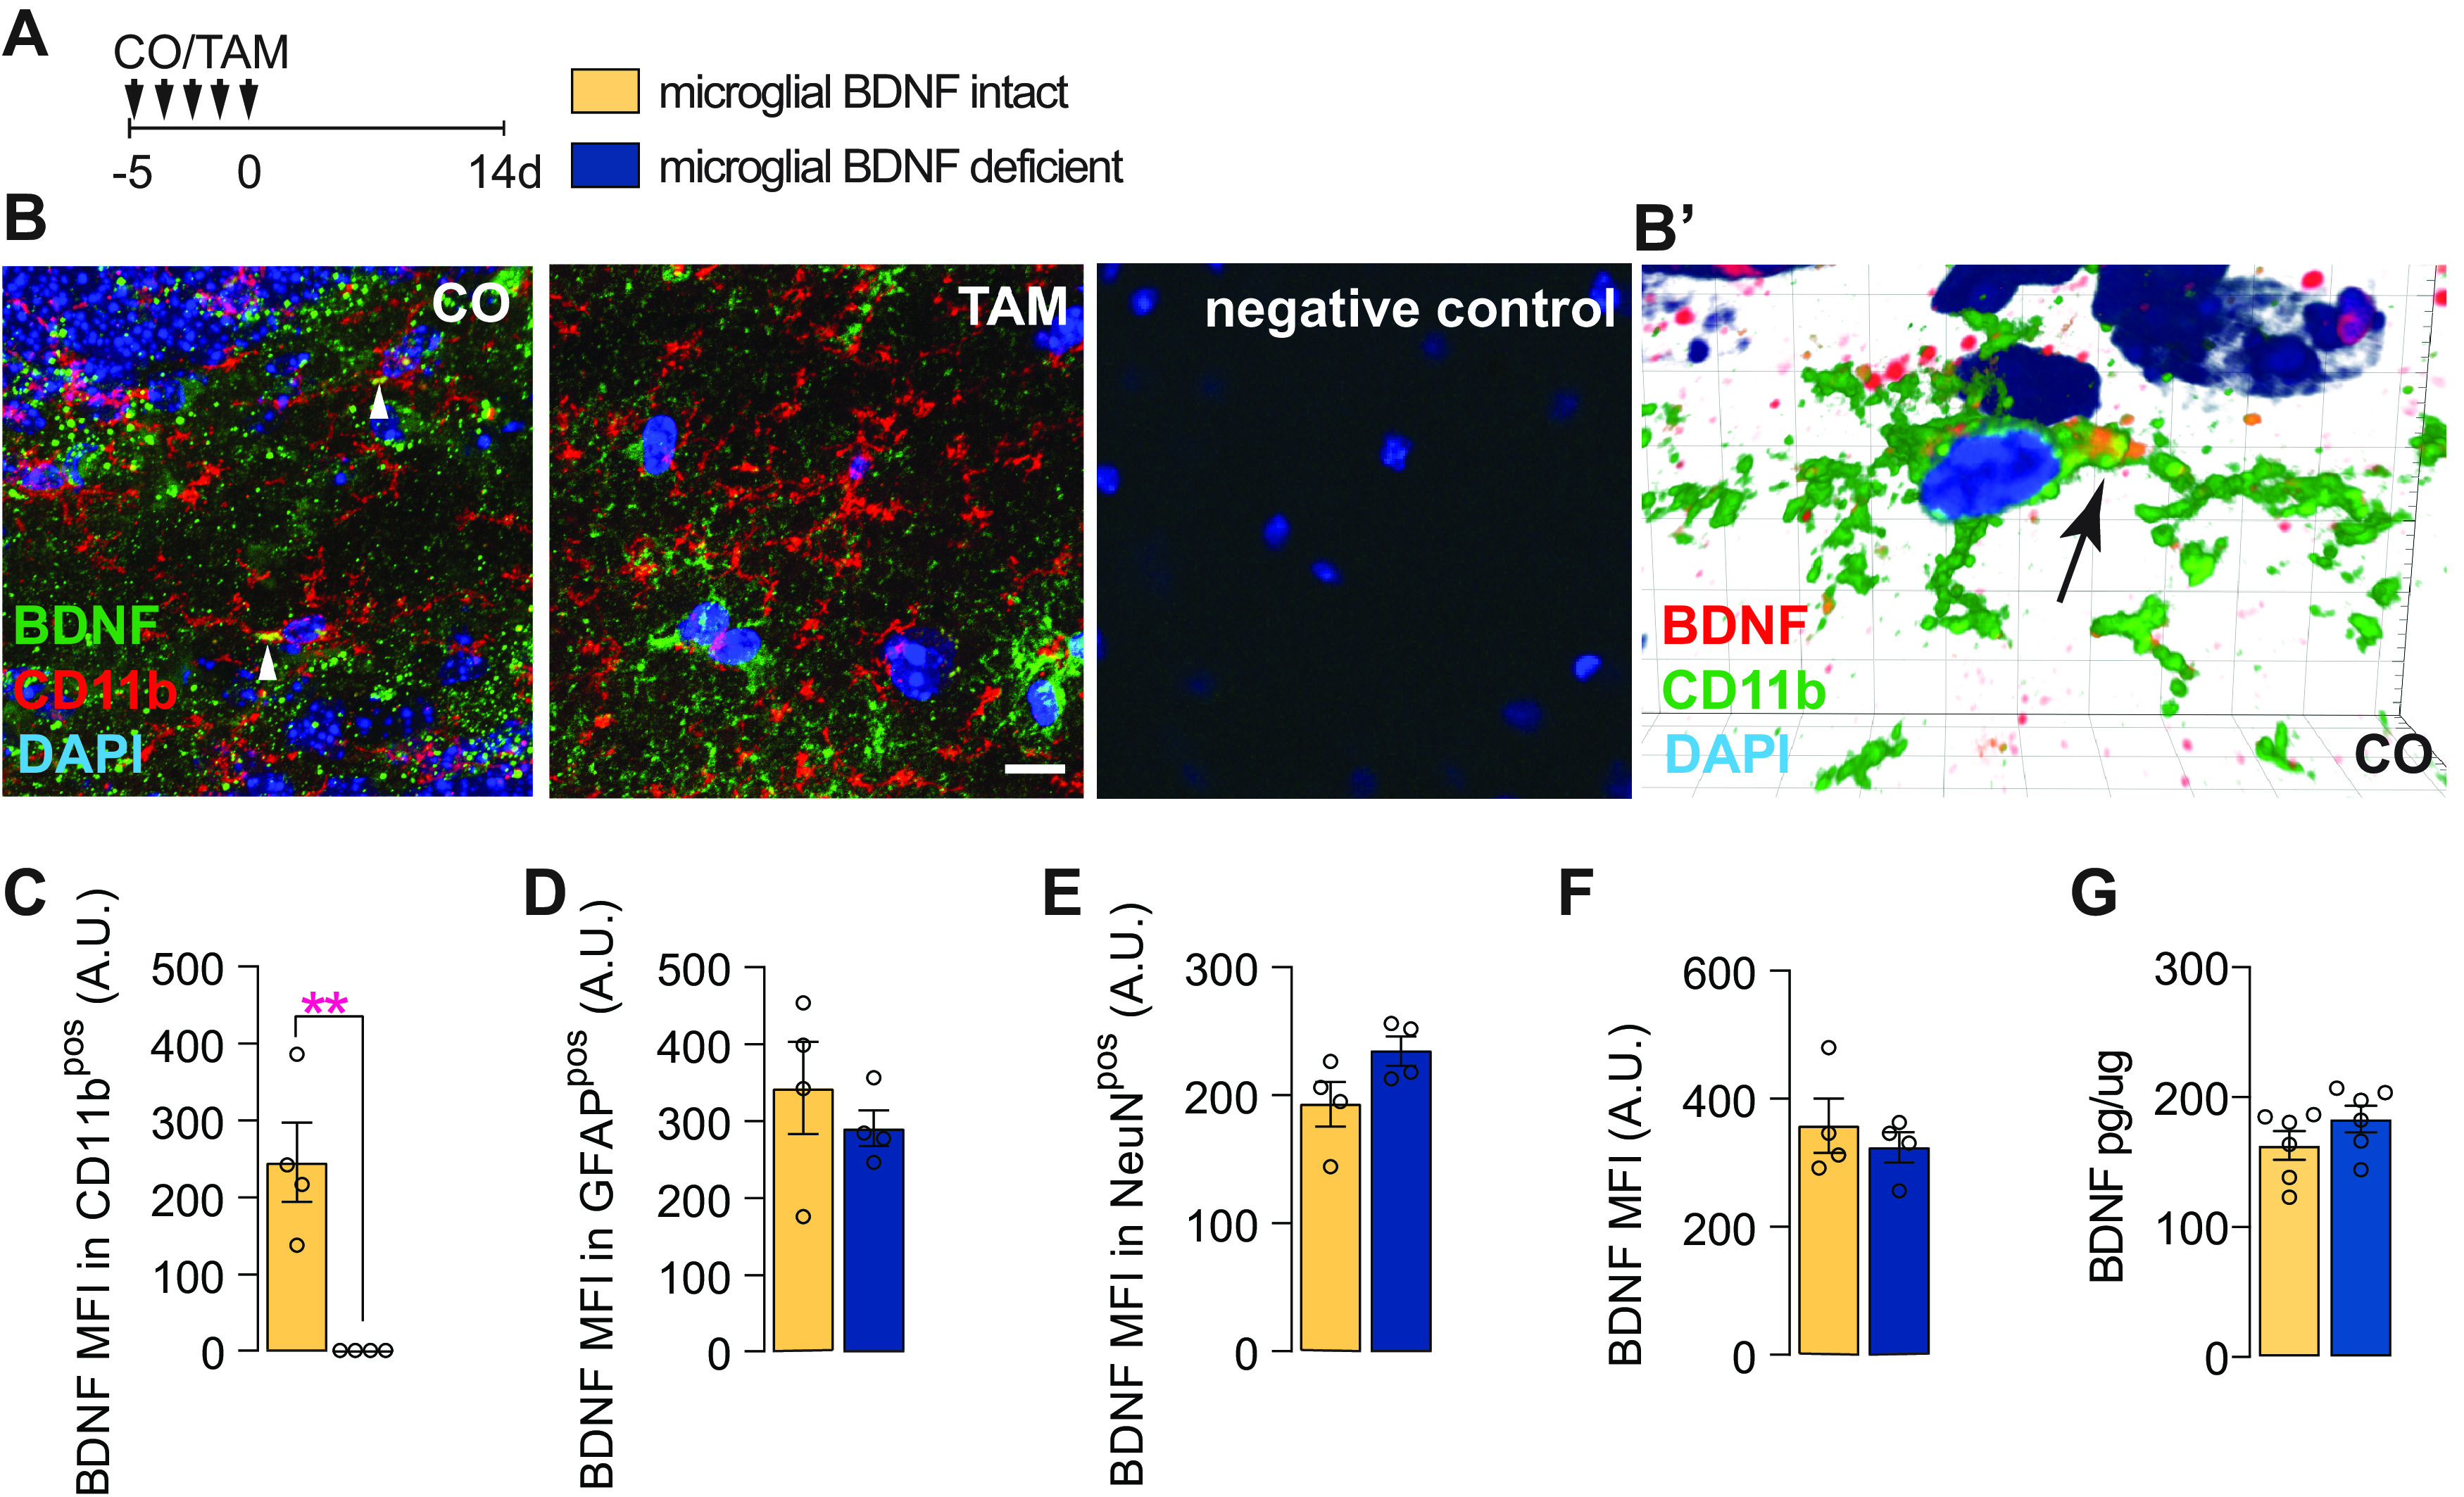
Figure 1.

BDNF ablation in microglia in Cx3cr1creERT2 x Bdnf flox/flox mice. A, Experimental timeline for microglial BDNF ablation in Cx3cr1creERT2 x Bdnf flox/flox mice. B, Confocal images showing BDNF immunostaining in Cx3cr1creERT2 x Bdnf flox/flox mice treated with CO or TAM; arrows indicate expression of BDNF in CD11bpos microglia. B′, Imaris 3D reconstruction showing BDNF in CD11bpos brain microglia in Cx3cr1creERT2 x Bdnf flox/flox mice treated with corn oil. C, Quantification of BDNF MFI within CD11bpos microglia (t(6) = 4.74, p = 0.0032). D, Quantification of BDNF MFI within GFAPpos cells (t(6) = 0.45, p = 0.45). E, Quantification of BDNF MFI within NeuNpos cells (t(6) = 2.01, p = 0.092). F, Quantification of total BDNF MFI within the hippocampus (t(6) = 0.69, p = 0.51). G, ELISA quantification of BDNF protein levels in the hippocampus of Cx3cr1creERT2 x Bdnf flox/flox mice 6 d after tamoxifen-induced microglial BDNF deletion (t(10) = 1.34, p = 0.19). Data represent the mean ± SEM. **p < 0.01. Statistical tests: unpaired Student's t test (C–G). A.U., Arbitrary units. Small circles represent individual mice.
