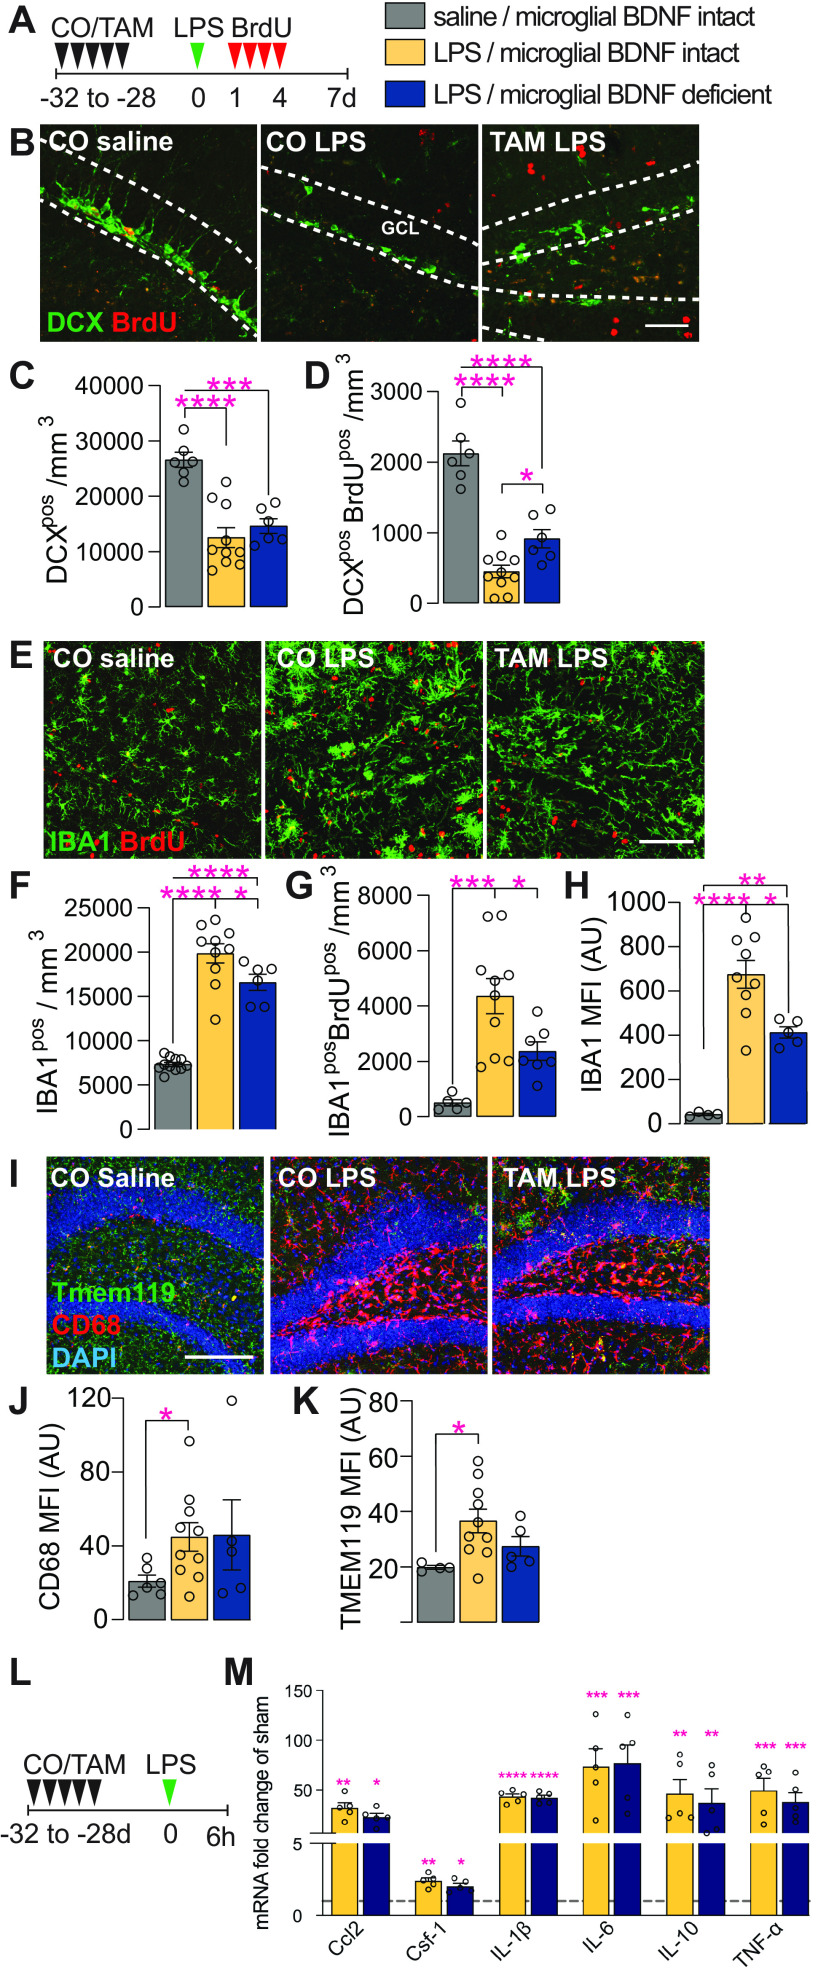
Figure 5.
Microglial BDNF deficiency supports newborn immature neuron survival and reduces microglial proliferation following LPS infection. A, Experimental timeline for intraperitoneal BrdU injection following intrahippocampal LPS administration in Cx3cr1creERT2 x Bdnf flox/flox mice. B, Representative images of DCXpos and DCXposBrdUpos immature neurons in the dentate gyrus. Scale bar, 50 μm. Dotted lines indicated the GCL. C, Quantification of DCXpos immature neurons 7 d after intrahippocampal LPS injection (F(2,19) = 18.98, p < 0.0001). D, Quantification of newly born DCXposBrdUpos immature neurons that were born 1–4 d after LPS stimulation and survive until day 7 post-LPS (F(2,19) = 47.39, p < 0.0001). E, Representative confocal images of IBA1posBrdUpos microglia in the dentate gyrus. Scale bar, 50 μm. F, Quantification of IBA1pos microglia in the dentate gyrus (F(2,24) = 76.99, p < 0.0001). G, Quantification of IBA1posBrdUpos microglia in the dentate gyrus (F(2,19) = 11.87, p = 0.0005). H, Quantification of IBA1pos mean fluorescence intensity (F(2,15) = 28.31, p < 0.0001). I, Representative confocal images of Tmem119pos, CD68pos microglia in the dentate gyrus. J, K, Quantification of TMEM119pos (J: F(2,16) = 3.73, p = 0.047) and CD68pos (K: F(2,16) = 2.17, p = 0.15) mean fluorescence intensity. L, Experimental timeline for Cx3cr1creERT2 x Bdnf flox/flox killed 6 h after intrahippocampal LPS administration. M, qPCR data for select genes associated with the neuroinflammatory response to LPS infection in the ipsilateral hippocampus of Cx3cr1creERT2 x Bdnf flox/flox mice 6 h after saline or LPS injection. Expression is relative to the Hprt housekeeping gene and presented as the “fold change” from saline-injected corn oil-gavaged vehicle controls (Ccl2: F(2,10) = 11.70, p = 0.0024; Csf-1: F(2,10) = 12.56, p = 0.0019; IL-1β: F(2,10) = 77.99, p < 0.0001; IL-6: F(2,10) = 4.87, p = 0.033; IL-10: F(2,10) = 3.88, p = 0.035; TNF-α: F(2,10) = 5.08, p = 0.030, n = 3–5/group). Data represent the mean ± SEM. *p < 0.05, **p < 0.01, ***p < 0.001, ****p < 0.0001. Statistical tests: one-way ANOVA followed by Bonferroni post hoc comparison; asterisks indicate post hoc results (C, D, F–H, J, K, M). Small circles represent individual mice. A.U., Arbitrary units.

