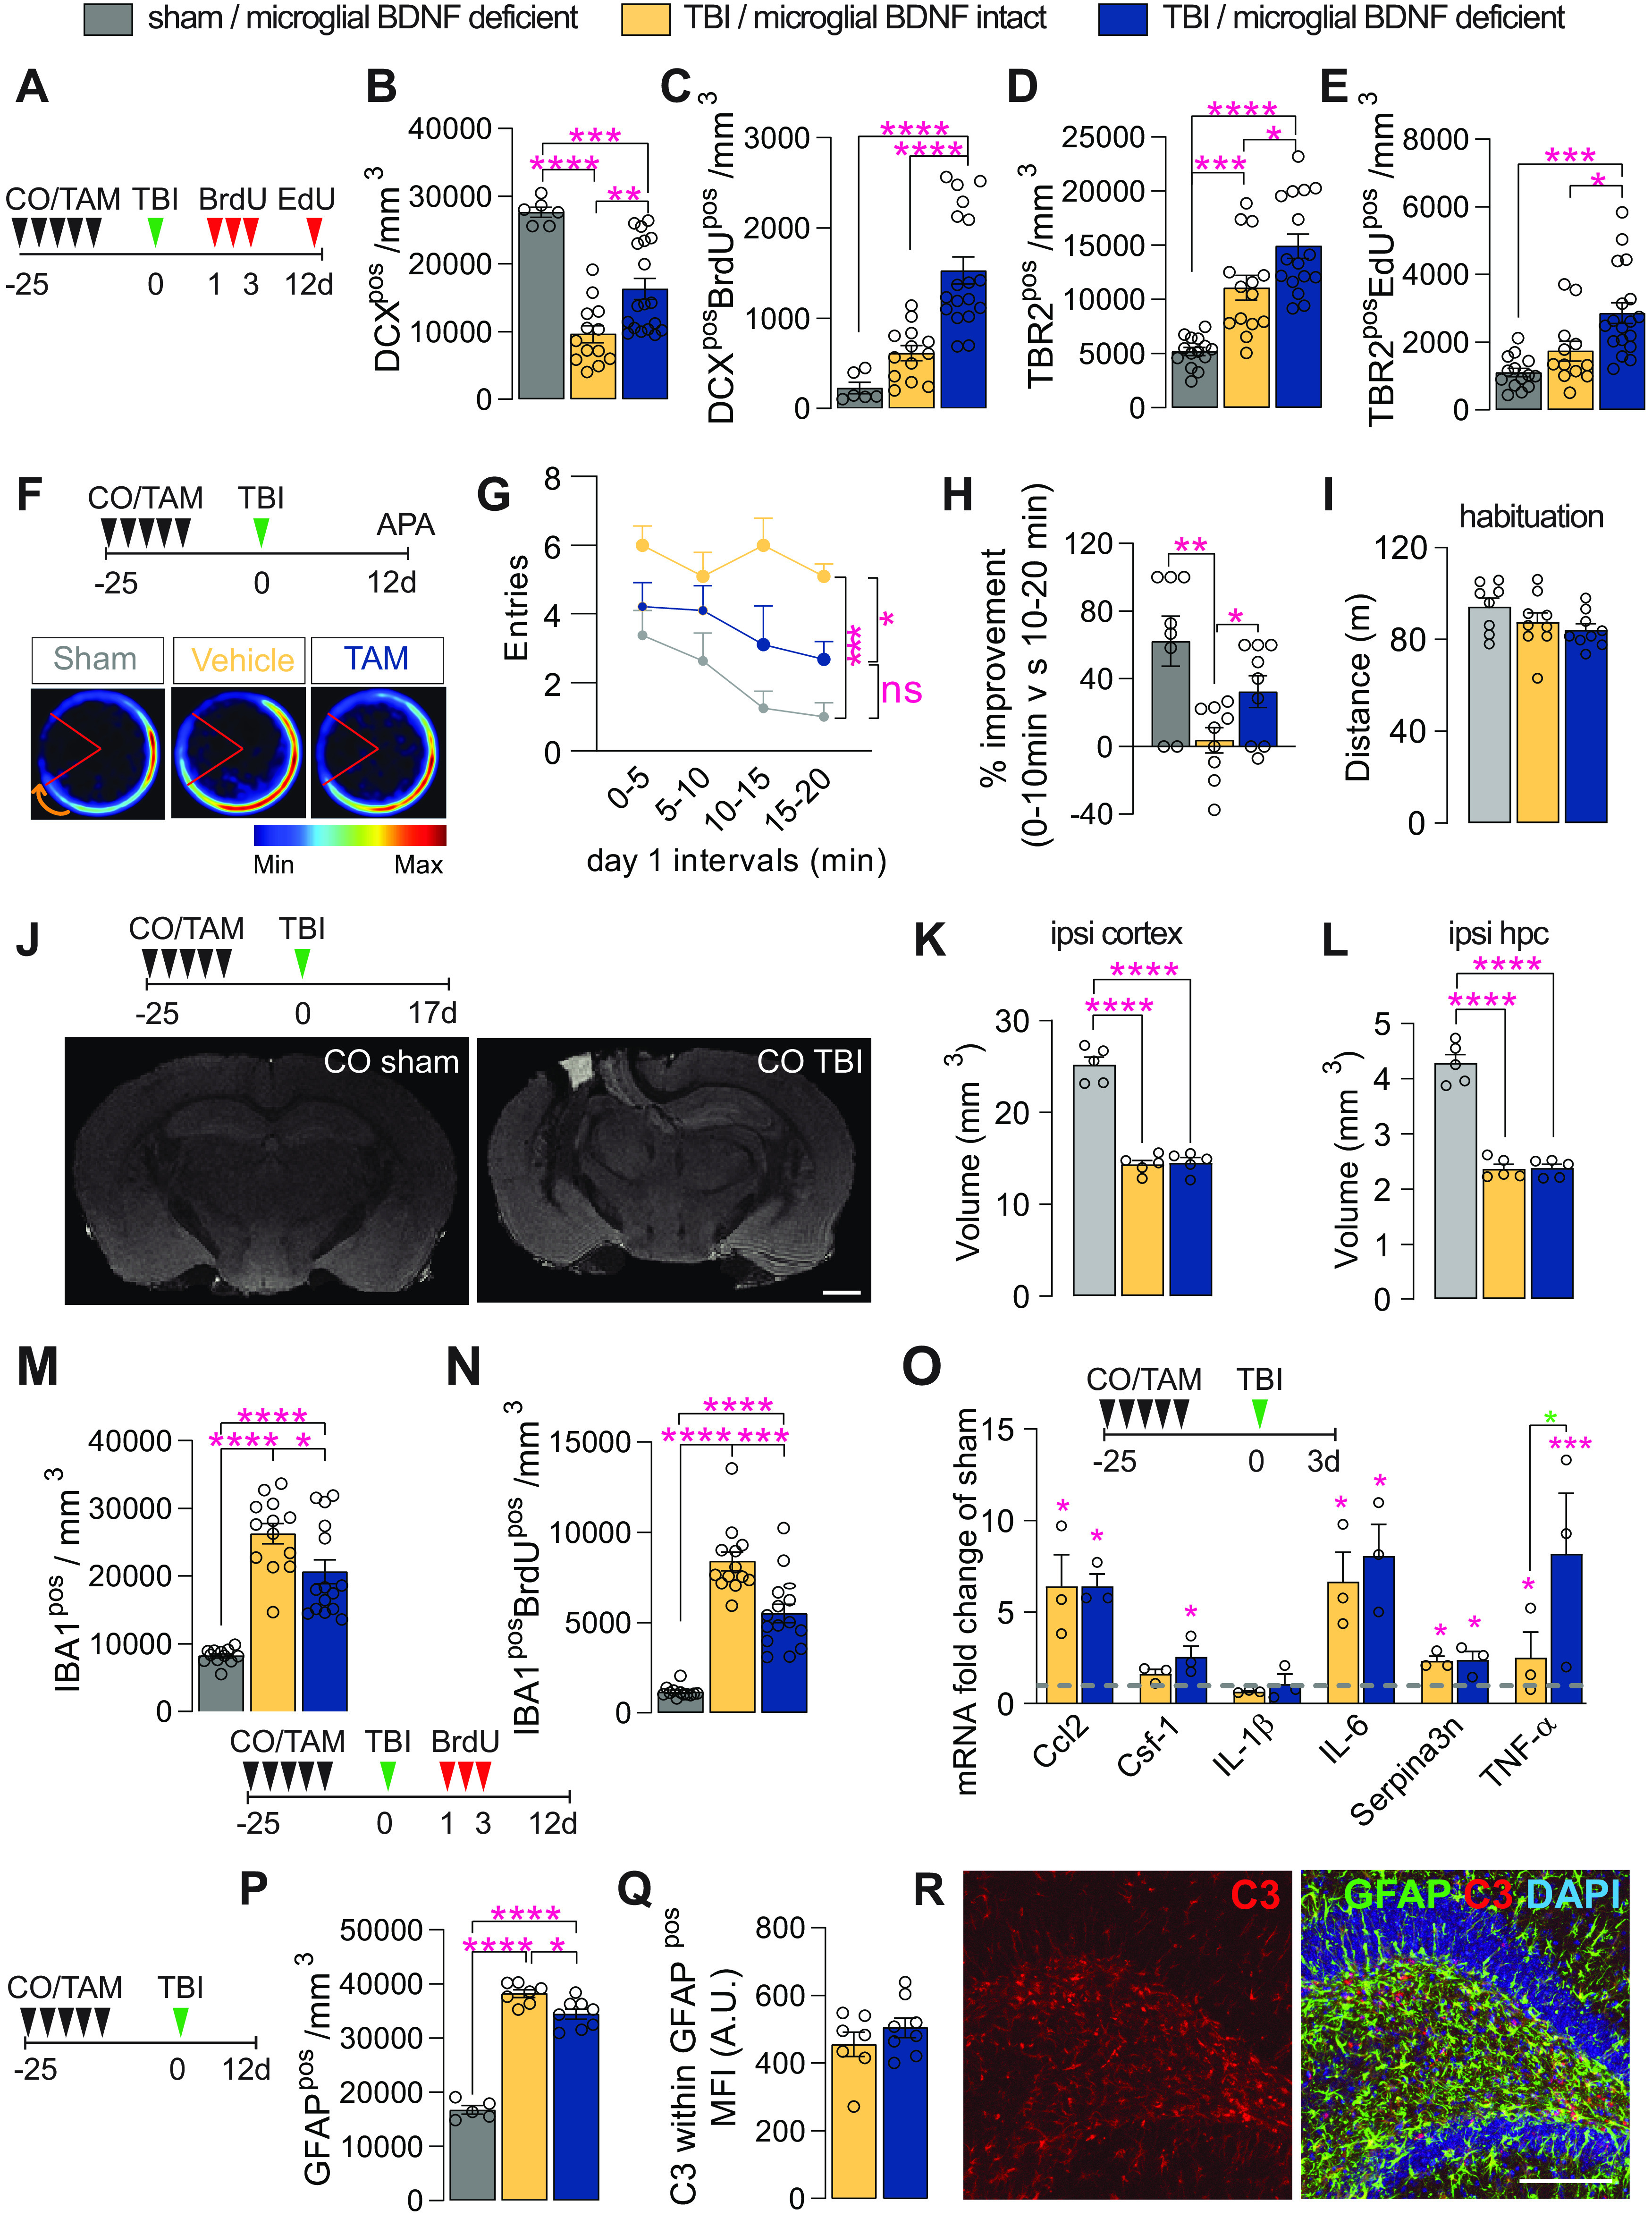
Figure 6.

Microglial BDNF deficiency stimulates hippocampal neurogenesis and has a modest effect on short-term learning and memory, while reducing microglial proliferation following traumatic brain injury. A, Experimental timeline for intraperitoneal injection of BrdU and EdU in Cx3cr1creERT2 x Bdnf flox/flox mice following sham or TBI surgery. B, Quantification of total DCXpos immature neurons at 12 d postinjury (F(2,34) = 22.55, p < 0.0001). C, Quantification of immature neurons (i.e., DCXposBrdUpos) born after TBI that survive until day 12 postinjury (F(2,34) = 22.36, p < 0.0001). D, E, Quantification of total (D: F(2,41) = 25.95, p < 0.0001) and proliferating (E: F(2,41) = 12.34, p < 0.0001; TBR2posEDUpos) TBR2pos neural precursors at 12 d postinjury. F, Experimental timeline for microglial BDNF ablation in Cx3cr1creERT2 x Bdnf flox/flox mice followed by TBI surgery and APA testing. Merged heatmaps showing the mean proportion of time spent in a particular location during day 1 of APA testing. G, Within-session APA performance of sham and TBI mice with and without microglial BDNF ablation on day 1 of testing (F(2,23) = 13.04, p = 0.0002). Asterisks indicate post hoc results for the 15–20 min interval between groups. H, Percentage improvement in APA within-session performance for individual mice, as assessed by the change in the number of shock zone entries between the first and the last 10 min of the 20 min session (F(2,23) = 7.45, p = 0.0032). I, Distance traveled during habituation trial of APA testing (F(2,23) = 2.09, p = 0.15). J, Top, Experimental timeline for microglial BDNF ablation in Cx3cr1creERT2 x Bdnf flox/flox mice and ex vivo MRI 17 d after TBI surgery. Bottom, T1/T2 FLASH images of sham-operated and TBI mice. K, L, T1/T2 ex vivo MRI measurements of total spared tissue volumes for the ipsilateral (ipsi) cortex (K: F(2,12) = 94.21, p < 0.0001), and ipsilateral hippocampus (L: F(2,12) = 92.63, p < 0.0001), in both sham and TBI mice with microglial BDNF intact or ablated. M, Quantification of IBA1pos microglia in the dentate gyrus 12 d post-TBI (F(2,37) = 38.82, p < 0.0001). N, Quantification of IBA1posBrdUpos newborn microglia born on days 1–3 post-TBI and surviving until day 12 post-TBI (F(2,37) = 61.86, p < 0.0001). O, qPCR data for select genes associated with TB1-related immune processes in the ipsilateral hippocampus of Cx3cr1creERT2 x Bdnf flox/flox mice with intact versus ablated microglial BDNF 3 d after TBI. Expression is relative to the Hprt housekeeping gene and presented as the “fold change” from sham-operated controls (dotted gray line; Ccl2: F(2,7) = 11.65, p = 0.0059; Csf-1: F(2,7) = 5.93, p = 0.031; IL-1β: F(2,7) = 0.54, p = 0.61; IL-6: F(2,7) = 10.30, p = 0.0082; Serpina3n: F(2,7) = 7.23, p = 0.020; TNF-α: F(2,7) = 33.03, p = 0.0003; t test analysis for TNF-α: t(7) = 3.99, p = 0.016 (blue asterisk). P, Quantification of GFAPpos astrocytes in the dentate gyrus (F(2,17) = 153.6, p < 0.0001). Q, Quantification of C3 MFI within GFAPpos astrocytes in the ipsilateral dentate gyrus of Cx3cr1creERT2 x Bdnf flox/flox mice after TBI surgery (t(13) = 1.07, p = 0.31). R, Representative confocal images of GFAPposC3pos astrocytes in the dentate gyrus. Data represent the mean ± SEM. *p < 0.05, **p < 0.01 ***p < 0.001, ****p < 0.0001. Statistical tests: one-way ANOVA, B–E, G, I, K–P, Q; repeated-measures two-way ANOVA, H; followed by Bonferroni post hoc comparison test for all; asterisks indicate ANOVA post hoc result; unpaired Student's t test, Q. n = 6–18/group (B–E), n = 8–10/group (G–I), n = 5/group (K, L), n = 12–15 (M, N), n = 3/group (O), n = 7–8/group (P, Q). Circles represent individual mice. A.U., arbitrary units.
