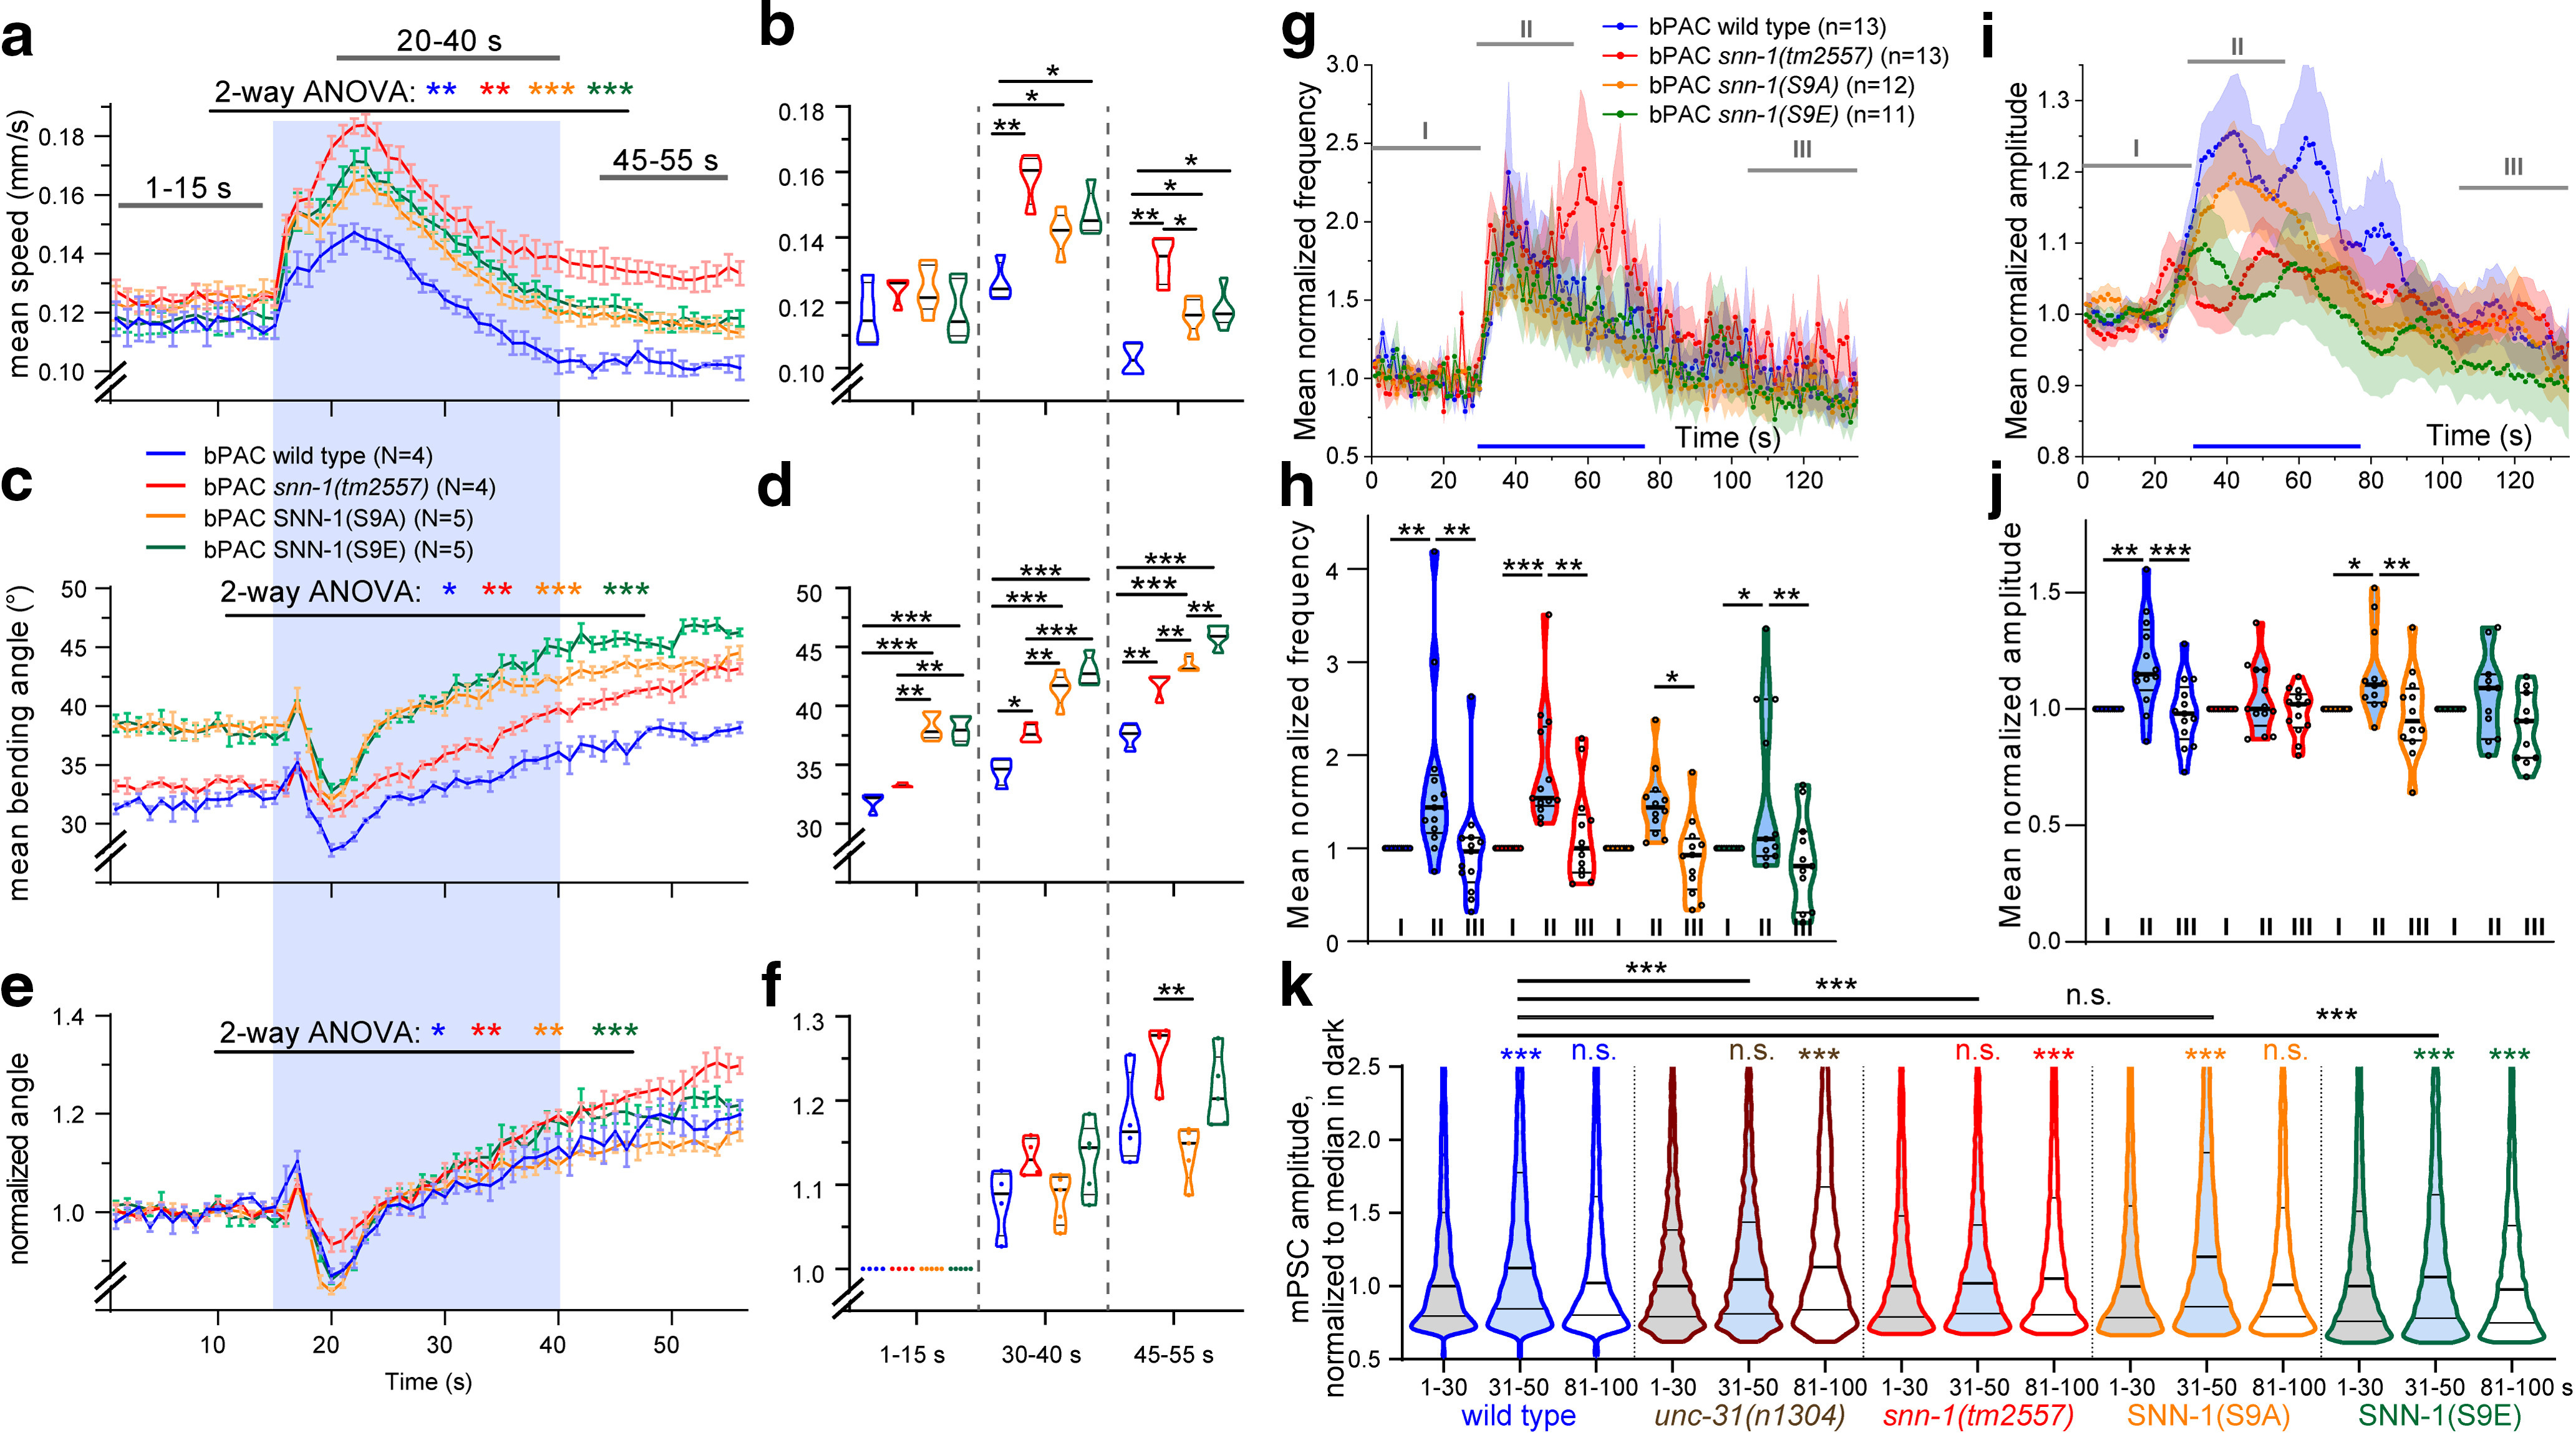
Figure 6.

SNN-1B serine 9 mutations affect behaviors and postsynaptic currents induced by bPAC stimulation. a-f, Multiworm tracking (Swierczek et al., 2011) analysis of SNN-1B S9A and S9E mutants, as well as snn-1 and wt animals (N = 4 or 5 replicates, n = 60-100 animals each). S9A and S9E mutations affect bPAC induced changes in crawling velocity (a,b) and bending angles (c–f; e, f, normalized to initial value) compared with wt and snn-1(tm2557). a, c, e, Mean (±SEM). b, d, f, Velocities and bending angles in the indicated time windows shown as median and 25/75 quartiles. Blue shade in a, c, e represents illumination period. g, h, Mean, normalized mPSC events per second before (I), during (II), and after (III) presynaptic bPAC stimulation in cholinergic neurons, in the indicated genotypes. Blue bar represents blue light stimulation period. i, j, Mean (±SEM) normalized mPSC amplitudes in 1 s bins, before, during, and after photoactivation. k, Frequency distribution analysis of mPSC amplitudes in different time periods before, during, and after bPAC photostimulation, as indicated. Datasets represent 3223-13,348 single events. A shift to generally higher amplitudes is apparent for wt, S9A, and S9E animals, but no distinct populations of higher mPSC amplitudes emerge. *p < 0.05; **p < 0.01; ***p < 0.001; paired and unpaired t test (b,d,f) or two-way ANOVA (a,c,e,h,j) with Bonferroni post-test. g, i, Some data are replotted from Figure 2.
