Figure 1.

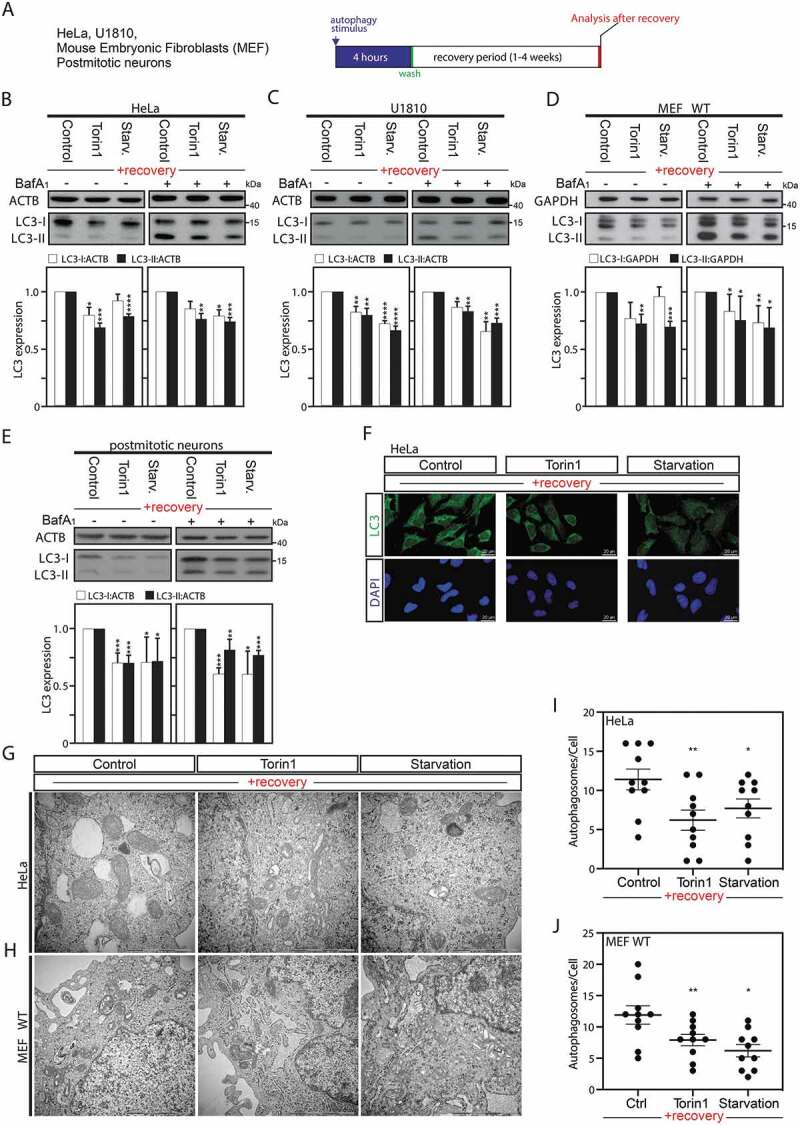
Autophagy induction is associated with a sustained downregulation of MAP1LC3 protein expression after a recovery period. (A) Illustrative pipeline of the “previously-autophagy exposed cells” generation and analysis after a recovery period. (B–E) Immunoblot analysis and quantification of LC3-I and LC3-II expression versus ACTB or GAPDH in HeLa cells (B), U1810 cells (C), wild-type (WT) MEF cells (D), or post-mitotic neurons (E), starved (Starv.), pretreated with torin1, or DMSO (used as control) for 4 h and thereafter left to recover and analyze after 2 weeks (B and C), one week (D), or 8 d (E) under normal cell culture conditions. Treatment with the late inhibitor of autophagy bafilomycin A1 (BafA1) before sample collection validates that the observed overall decrease in LC3 expression was not the result of an increase in autophagic flux (B to E). (F) Immunofluorescence confocal microscopy imaging of endogenous LC3 in HeLa cells after 2-week recovery period. (G to J) Ultrastructural analysis by electron microscopy of HeLa cells (G and I) or MEF cells (H and J), starved, pretreated with torin1, or DMSO (used as control) for 4 h and thereafter left to recover and analyze after 2 weeks (HeLa cells), or one week (MEF cells). Panels I and J are quantification of number of autophagosomes per cell. 10 cells were counted per conditions. All values are a mean of at least 3 independent experiments ± SEM and considered significant for *p < 0.05, **p < 0.01, ***p < 0.001, ****p < 0.0001. n.s., not significant for the indicated comparison. (B-E, n = 3–5; I-J, n = 10)
