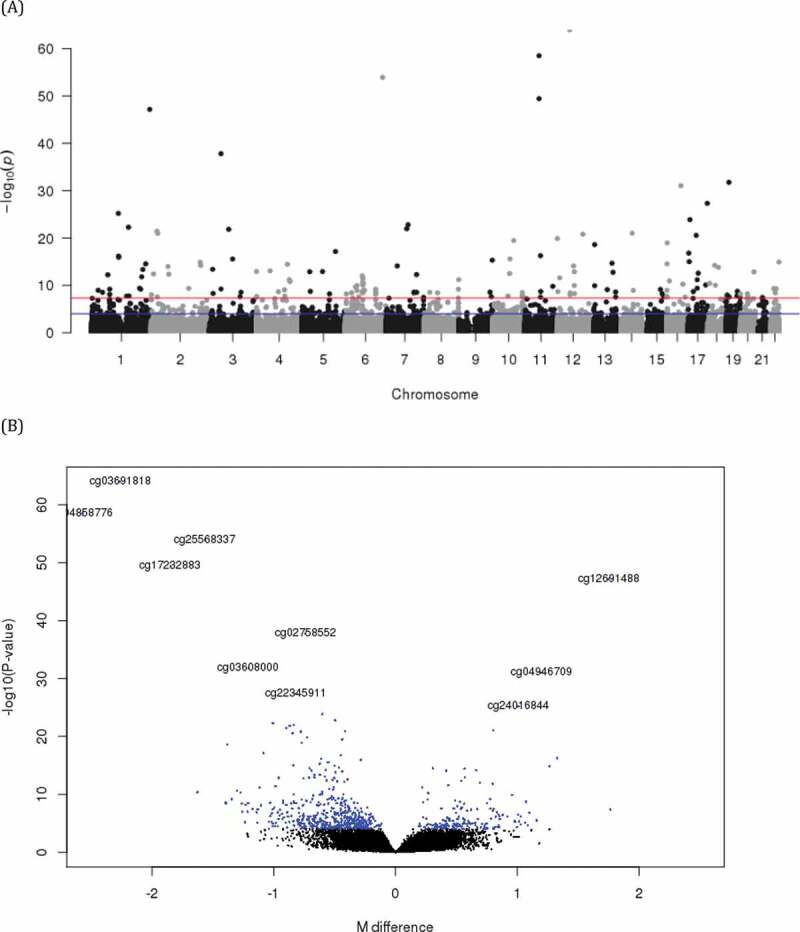
Figure 1.

Manhattan plot (a) and volcano plot (b) of CpG sites differentially methylated by sex (A) The blue line represents the threshold for an FDR of 5%, and the red line represent genome-wide significance cut-off of P = 5 × 10⁻⁸. (B) The M value difference of methylation for each CpG site is plotted on the x-axis, and log-transformed P value is plotted on y-axis. Each point represents an individual CpG site. Only top 10 significant sites were annotated with CpG name
