Figure 1.

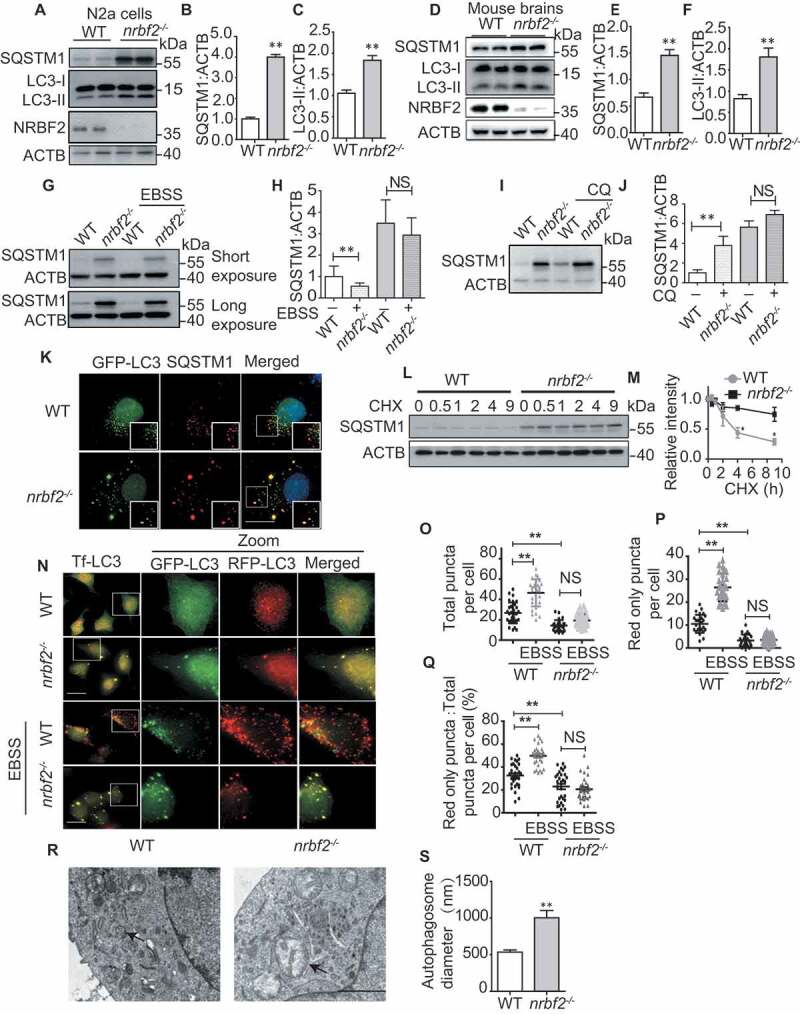
NRBF2 is required for autophagosome maturation. (A-C) Generation of nrbf2-/- N2a cells by CRISPR-Cas9 technique and WB analysis of LC3-II and SQSTM1 levels in WT and nrbf2-/- N2a cells. Data are quantified as mean ± SEM (n = 3). NS, not significant; *P < 0.05, **P < 0.01, vs. the relative control. (D-F) WB analysis of LC3-II and SQSTM1 levels in WT and nrbf2-/- mice brain. Data are quantified as mean ± SEM (n = 3). NS, not significant; *P < 0.05, **P < 0.01, vs. the relative control. (G and H) SQSTM1 levels were determined by WB under starvation (EBSS) condition both in WT and nrbf2-/- N2a cells. Data are quantified as mean ± SEM (n = 3). NS, not significant; *P < 0.05, **P < 0.01, vs. the relative control. (I and J) SQSTM1 levels were determined by WB under lysosome inhibition CQ condition both in WT and nrbf2-/- N2a cells. Data are quantified as mean ± SEM (n = 3). NS, not significant; *P < 0.05, **P < 0.01, vs. the relative control. (K) N2a cells were transiently transfected with GFP-Lc3, and the colocalization of GFP-LC3 with endogenous SQSTM1 was visualized under confocal microscopy. Quantification data were presented as the mean ± SEM, n = 20–25 cells from 3 independent experiments. Scale bar: 10 μm. (L and M) Degradation of SQSTM1 in the presence of protein synthesis inhibitor cycloheximide (CHX) was tracked in WT and nrbf2-/- N2a cells by WB. Data are quantified as mean ± SEM (n = 3). *P < 0.05, **P < 0.01, vs. the relative control. (N-Q) Autophagosome maturation in WT and nrbf2-/- N2a cells was determined by the tf-LC3 probe under both basal and starvation conditions (EBSS). Quantification data were presented as the mean ± SEM, n = 20–25 cells from 3 independent experiments. NS, not significant; *P < 0.05, **P < 0.01, vs. the relative control. Scale bar: 20 μm. (R and S) Abnormally enlarged autophagosomes were observed in nrbf2-/- N2a cells by EM. Quantification data were presented as the mean ± SEM, n = 20. *P < 0.05, **P < 0.01, vs. the relative control. Scale bar: 2 μm
