Figure 2.

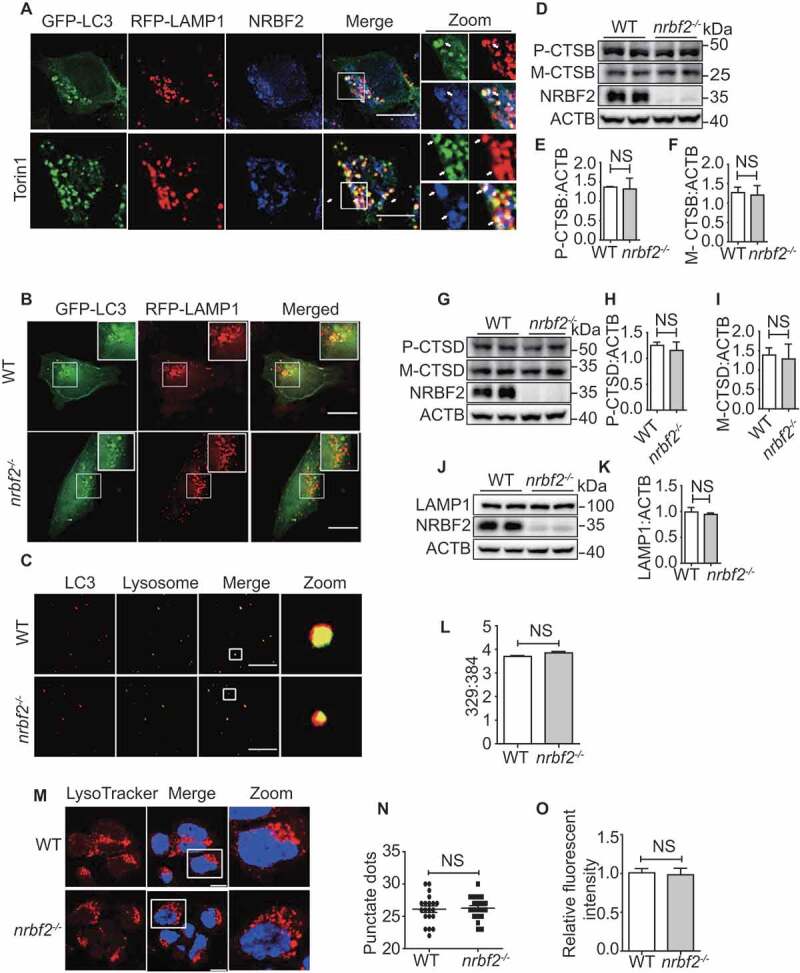
NRBF2 localizes at autolysosomes and is required for autolysosome maturation. (A) NRBF2 partially localizes with LC3- and LAMP1-positive autophagic structures under both basal and torin 1-treated conditions. N2a cells were transiently transfected with GFP-Lc3 and RFP-Lamp1, and then co-stained with NRBF2 antibody. Colocalization of NRBF2 and the autolysosome markers under normal or torin 1-treated conditions were visualized under confocal microscope. Scale bar: 10 μm. (B) WT and nrbf2-/- N2a cells were transiently transfected with GFP-Lc3 and RFP-Lamp1, the colocalization of autophagosomes and lysosomes was visualized under confocal microscope. Scale bar: 10 μm. (C) Purified autophagosome and lysosome isolated from starved WT and nrbf2-/- mice liver were incubated in an energy-regenerating buffer and stained with LC3 and LAMP1 antibody, respectively, to monitor the direct fusion between autophagosome and lysosome. Scale bar: 8.5 μm. (D-K) Lysosome proteins CTSB (cathepsin B), CTSD and LAMP1 were measured in WT and nrbf2-/- brain lysates. Data are quantified as mean ± SEM (n = 3). NS, not significant; vs. the relative control. (L) WT and nrbf2-/- N2a cells were stained with LysoSensor™ Yellow/Blue DND-160 and the Ex at 329 nm/384 nm were recorded with Em at 440 nm/540 nm to determine the acidification of lysosome. (M) WT and nrbf2-/- N2a cells were stained with LysoTracker (selective for acidic organelles, usually used to detect the number of lysosomes) to determine the quantity of lysosome. Scale bar: 200 μm. (N and O) Quantitative date from LysoTracker staining. Lysosomal numbers as reflected by LysoTracker staining dots and intensity. Quantification data were presented as the mean ±SEM, n = 20–25 cells from 3 independent experiments. NS, not significant
