
Figure 8.
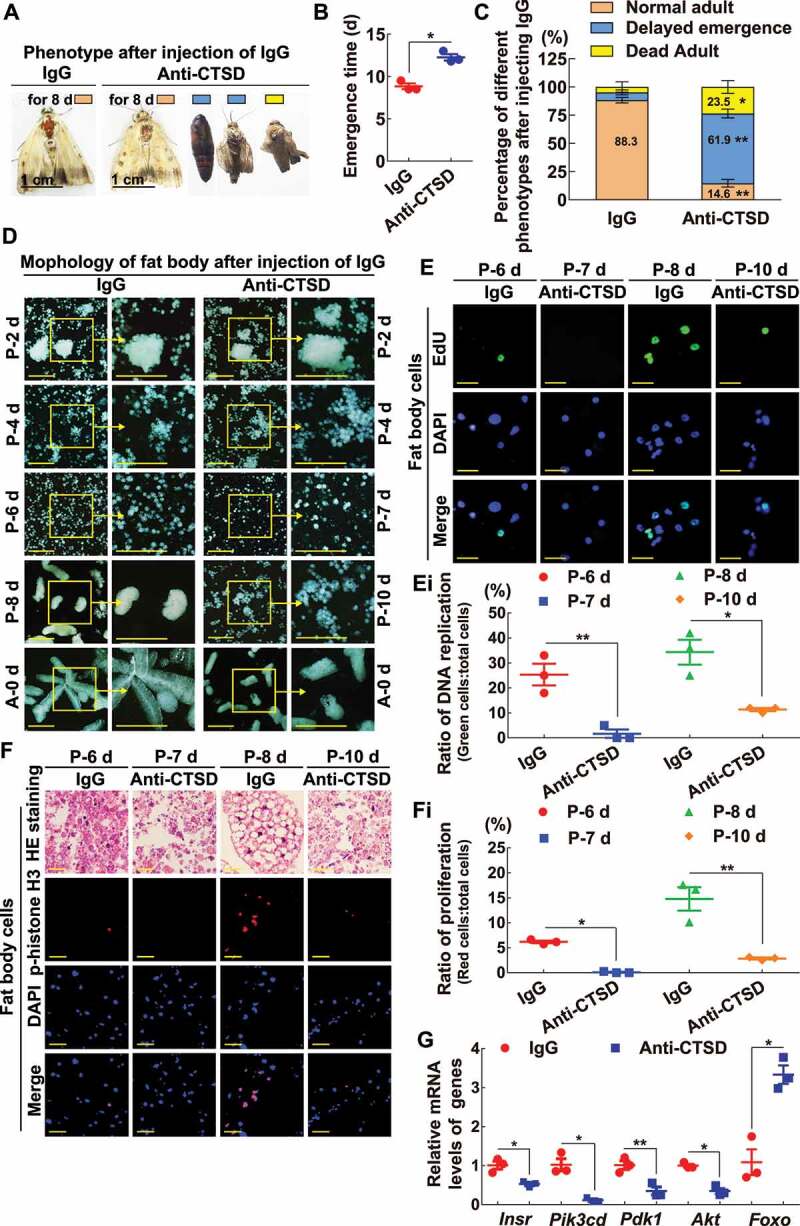
Neutralization of G-pro-CTSD by antibodies repressed imaginal fat body formation and emergence. (A) Phenotype of an adult after injection of anti-CTSD antibodies for 8 d (4 μg was injected into pupa on day 2 and day 4). IgG was a negative control for the antibody. (B) The time of emergence after the antibody injection (from pupa on day 0 to emergence). (C) The percentage of emergence after the antibody injection. The data were analyzed by Student’s t-test (*p < 0.05, **p < 0.01) based three repeats (3 × 30 larvae). (D) Morphology of the fat body after antibody injection. P-2 d to P-10 d: pupae on day 2 to 10. A-0 d: adult on day 0. Arrows indicated magnification. The bars showed 100 μm. (E) EdU staining DNA replication in the fat body after injection of anti-CTSD antibodies. Green fluorescence: EdU staining cells. Blue fluorescence: DAPI staining nuclei. The bars showed 20 μm. (Ei) Statistical analysis of the DNA replication in (E) by the ImageJ software. (F) p-histone H3 (phospho-histone H3) in the fat body after injection of anti-CTSD antibodies. Red fluorescence: phospho-histone H3 detected by anti-phospho-histone H3 (Ser10) antibodies. Blue fluorescence: DAPI staining nuclei. The bars showed 20 μm. (Fi) Statistical analysis of cell proliferation in (F) by the ImageJ software. (G) QRT-PCR detected the mRNA levels of Insr, Pik3cd, Pdk1, Akt, and Foxo after two days of injecting anti-CTSD antibodies and IgG. All of the experiments were conducted in equal development stages of equal eye pigment. The statistical analysis was performed using three independent replicates by Student’s t-test. Asterisks denote significant differences (*p < 0.05, **p < 0.01)