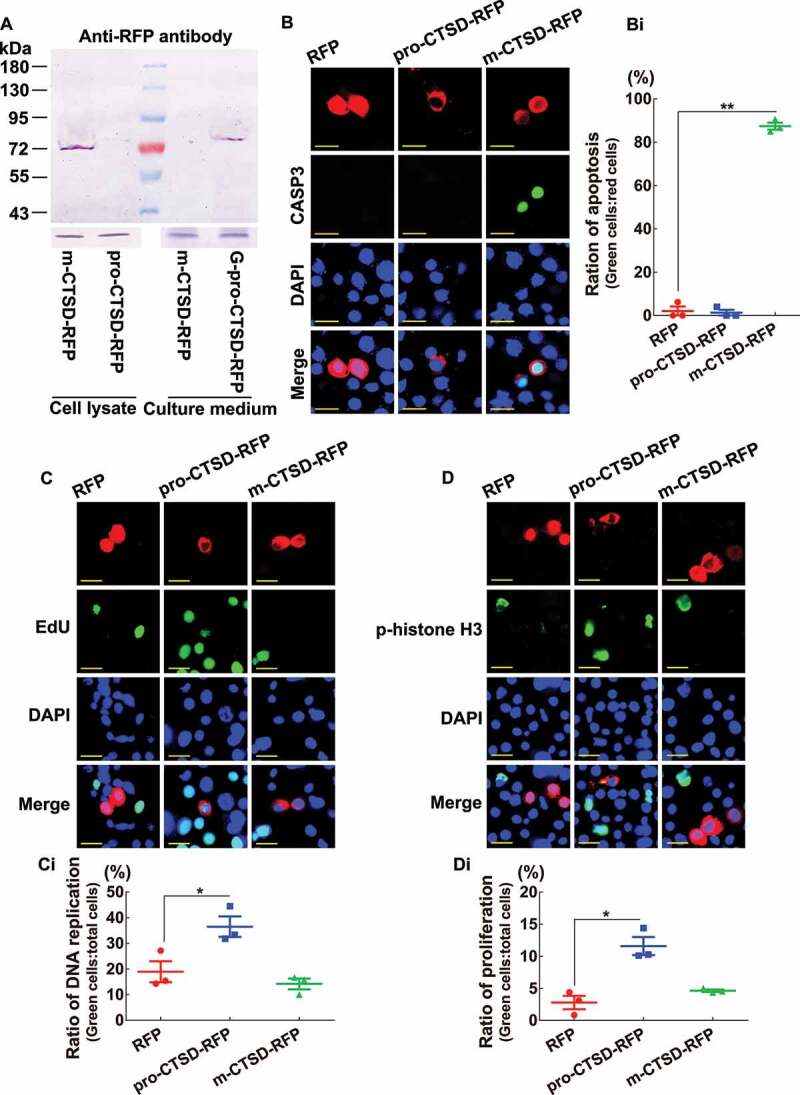
Figure 9.

M-CTSD induced apoptosis and pro-CTSD promoted cell proliferation. (A) Western blot showing the overexpression of m-CTSD-RFP and pro-CTSD-RFP in HaEpi cells in Grace’s medium, respectively. An antibody against RFP was used. ACTB and Grace’s medium were used as loading controls for cell lysate and culture medium, respectively (10% SDS-PAGE gel). (B) Detection of cell apoptosis by CASP3 activity. Red fluorescence represents RFP, pro-CTSD-RFP, or m-CTSD-RFP. Green fluorescence represents the CASP3 activity, as assessed using a CASP3 activity detection kit. Blue fluorescence indicates DAPI-stained nuclei. Merge: the superimposed images of the red, green, and blue fluorescence. Scale bar: 20 μm. (Bi) Statistical analysis of CASP3 active cells in (B). (C) Detection of DNA replication by the EdU assay. Red: RFP, pro-CTSD-RFP, and m-CTSD-RFP; Green: EdU; Blue: nucleus stained with DAPI; Merge: the overlapped red, green, and blue fluorescence. Bar: 20 μm. (Ci) Statistical analysis of EdU in (C). (D) Detection of cell proliferation by anti-phospho-histone H3 (Ser10) antibodies. Red: RFP, pro-CTSD-RFP, and m-CTSD-RFP; Green: phospho-histone H3; Blue: nucleus stained with DAPI; Merge: the overlapped red, green, and blue fluorescence. Bar: 20 μm. (Di) Statistical analysis of phospho-histone H3 in (D). All the experiments were performed in triplicate, and statistical analysis was conducted using Student’s t-test (*p < 0.05, **p < 0.01). The bars indicate the mean ± SD
