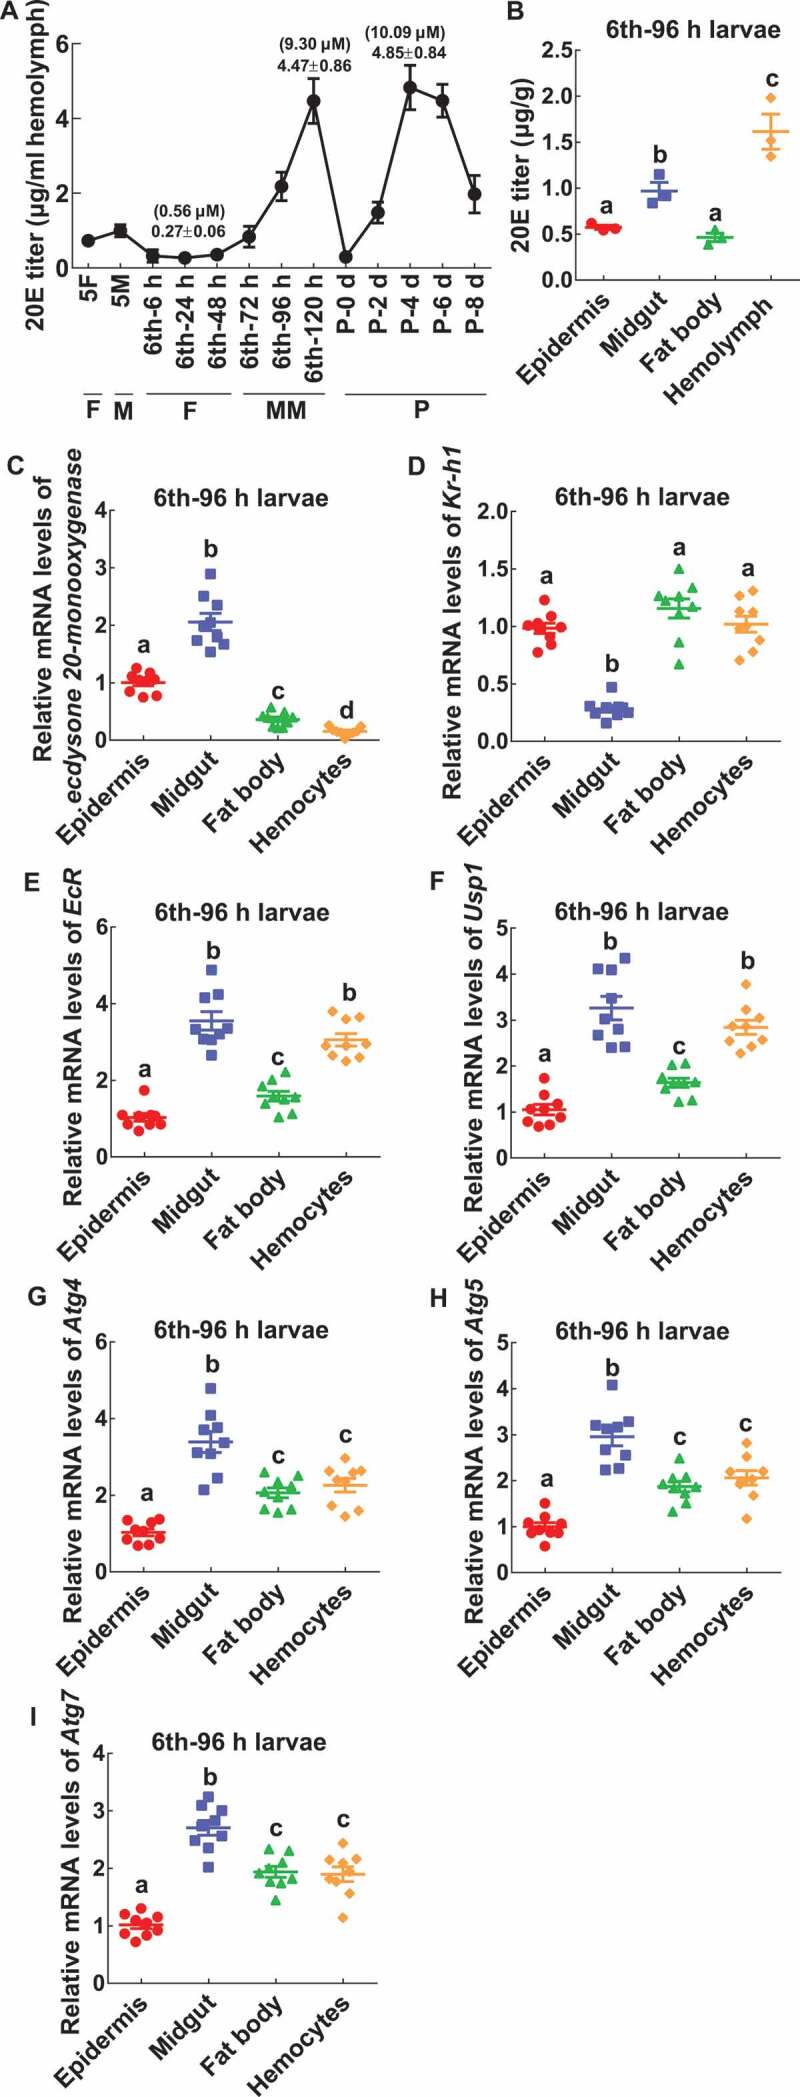
Figure 11.

The 20E titer and gene expression in tissues. (A) The 20E titer in the hemolymph. (B) The 20E titer in tissues. (C-I) The relative mRNA levels of ecdysone 20-monooxygenase, Kr-h1, EcR, Usp1, Atg4, Atg5, and Atg7. All the experiments were performed in triplicate, and statistical analysis was conducted using ANOVA; different lowercase letters indicate significant differences (p < 0.05). The bars indicate mean ± SD
