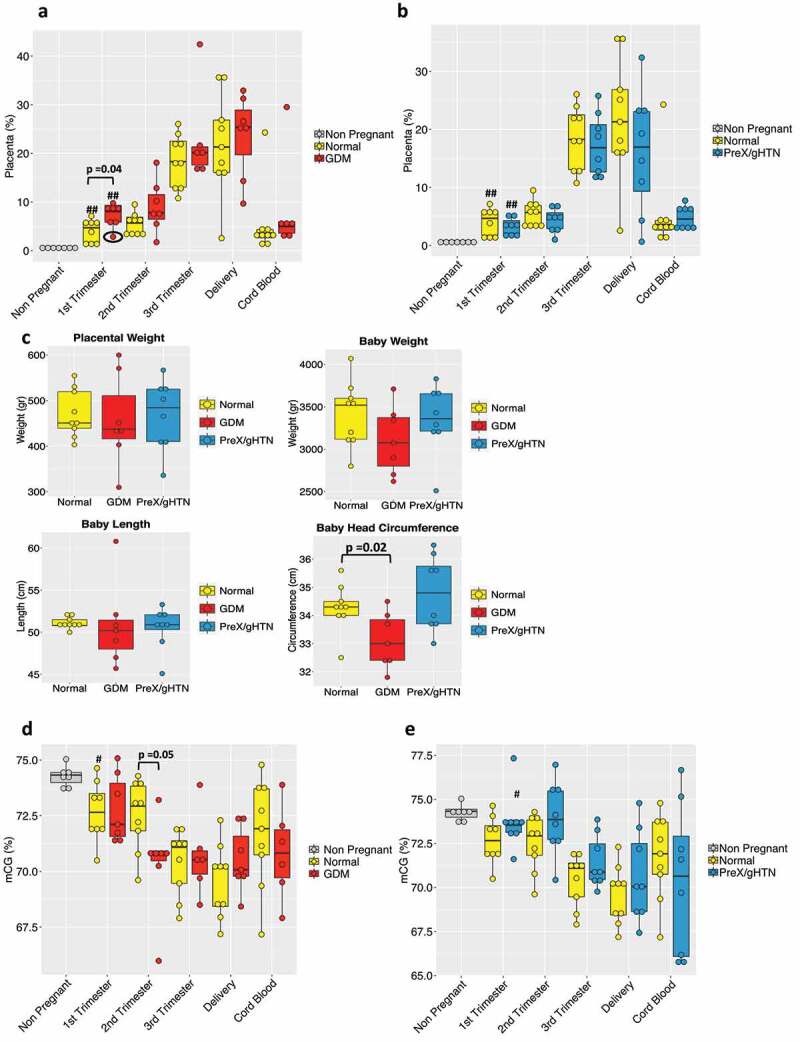
Figure 3.

Maternal plasma cfDNA composition and total CG methylation analysis in APOs. Box plot of the placental contribution expressed in percentage within the GDM (n = 7) (a) group or PreX/gHTN (n = 8) group (b) compared to subjects that did not develop any adverse outcomes during pregnancy (Normal; n = 9). The black circle (A) is to highlight the 1st trimester result for the single obese subject included in the GDM group. (c) Bar plot representing placental weight and baby’s measurements (weight, length, and head circumference) in normal, GDM and PreX/gHTN. Percentage of total CGs methylation in GDM (d) and PreX/gHTN groups (e) compared to the Normal group. The P-values were obtained by the non-parametric Mann-Whitney U test. Each dot represents an individual subject. (#) indicates statistically significant changes with respect to the non-pregnant. (#) p < 0.05; (##) p < 0.01
