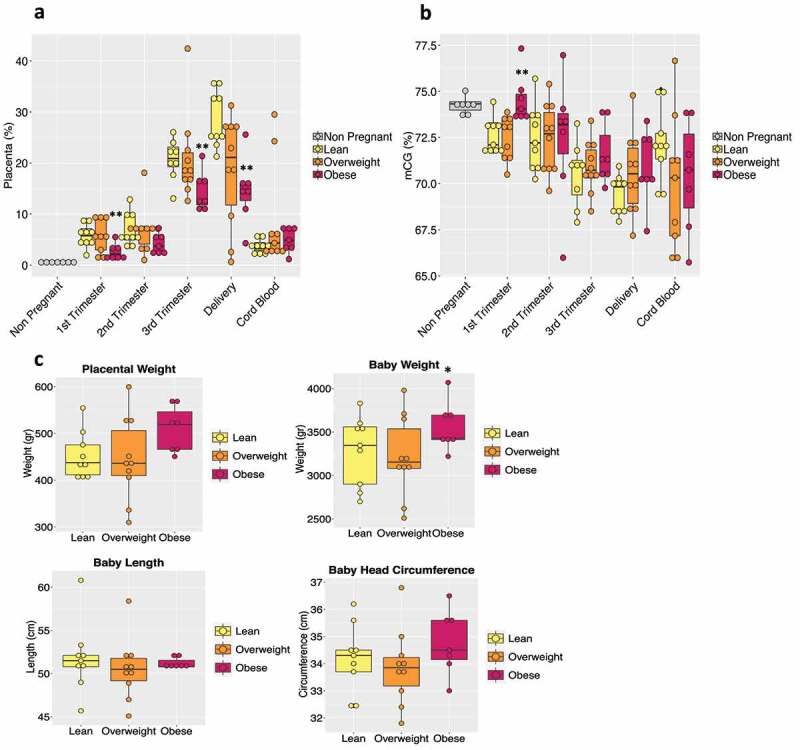
Figure 4.

BMI effect on maternal plasma cfDNA. (a) The box plot shows placental tissue's relative contribution to the total cfDNA pool according to BMI sub-groups (lean, n = 9; overweight, n = 10; obese, n = 7). The non-pregnant group is represented in the graph as a baseline threshold. No information regarding their BMIs was available. (b) Bar plot of total CG methylation percentage in the different BMI groups during pregnancy and in cord blood. (c) Bar plot representing the placental weight and baby’s measurements (weight, length, and head circumference) in each BMI sub-group is shown. Each dot in the graph represents a single subject in the study. The P-values were obtained by the non-parametric Mann-Whitney U test. (*) indicates statistically significant differences with respect to lean subjects. (*) p < 0.05; (**) p < 0.01
