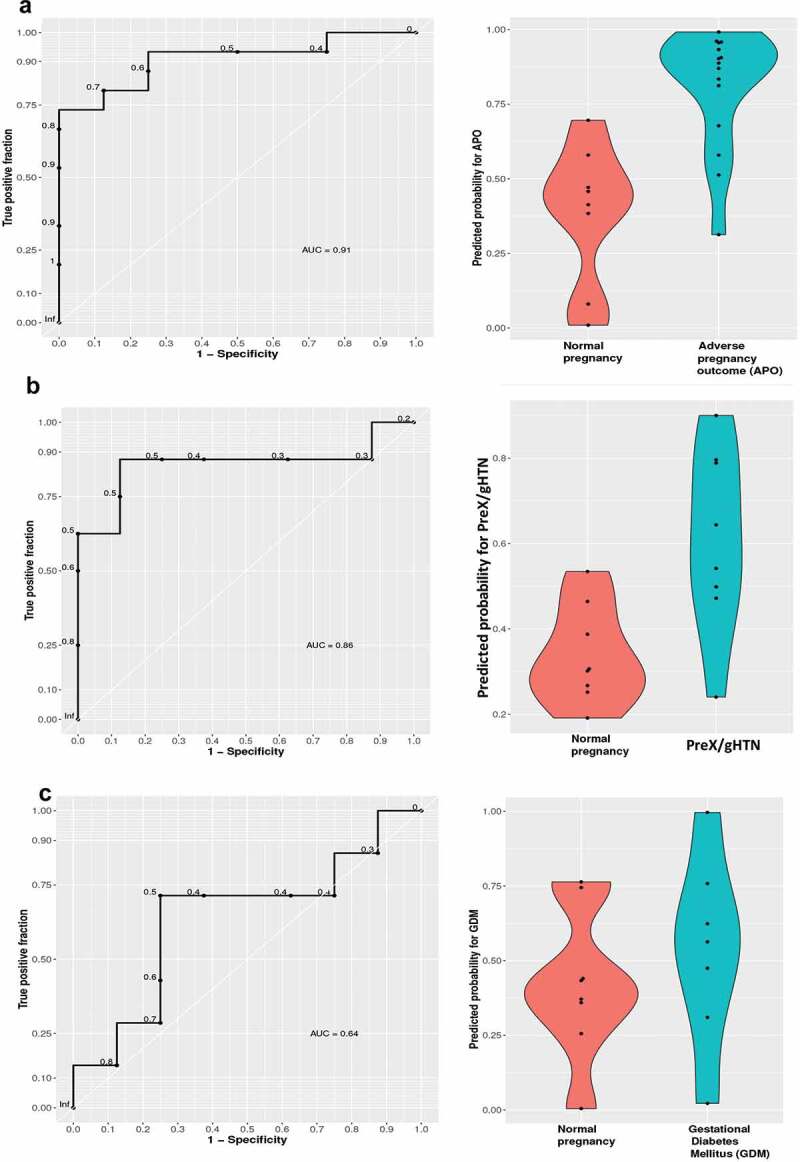
Figure 8.

Receiver operator curves (ROC) of classification models
We used cfRNA expression data for genes upregulated in pregnancy versus non-pregnant controls at an adjusted P value <0.1. (A) First trimester of pregnancy without complications n = 8 versus APOs, n = 15 (left panel); violin plot of the predicted probability for APOs with 0 = low probability and 1 = high probability in normal and APOs (right panel); (B) First trimester of pregnancy with PreX/gHTN, n = 8 versus normal pregnancy, n = 8 (left panel); violin plot of the predicted probability for pre-eclampsia with 0 = low probability and 1 = high probability in normal and complicated pregnancies with PreX/gHTN (right panel); (C) First trimester of pregnancy with GDM n = 7, versus normal pregnancy n = 8 (left panel); violin plot of the predicted probability for GDM with 0 = low probability and 1 = high probability in normal pregnancies and pregnancies with APOs: GDM (right panel).
