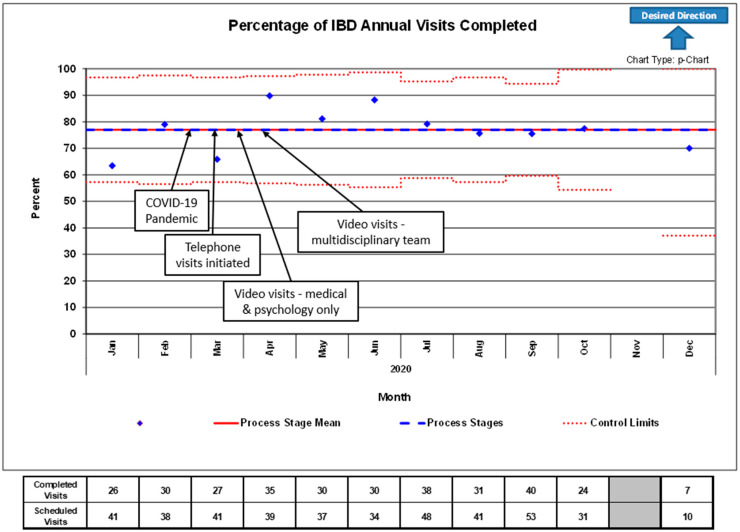
Figure 2.
Control chart of the percentage of IBD Annual Visits completed versus scheduled in the 2020 calendar year. Arrows and text boxes indicate the process of conversion from in-person to telemedicine visits due to COVID-19. Fewer IBD Annual Visits than average were scheduled between October and December due to a team member being out for personal reasons unrelated to COVID-19 or telemedicine. Control limits represent 3 standard deviations above and below the mean.

