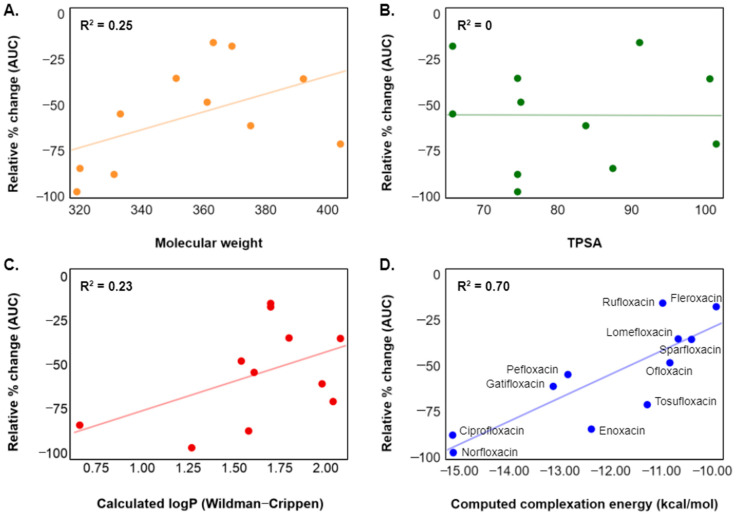
Figure 3.
Plots of relative percent change in bioavailability (AUC) versus (A) molecular weight, (B) topological polar surface area (TPSA) [45], (C) predicted logP from chemical structure (Wildman–Crippen model) [46], and (D) computed complexation energy (ΔEbind) to aluminum hexahydrate. Changes in AUC on the y-axis are from FQ coadministration with aluminum hydroxide [71] or Maalox.

