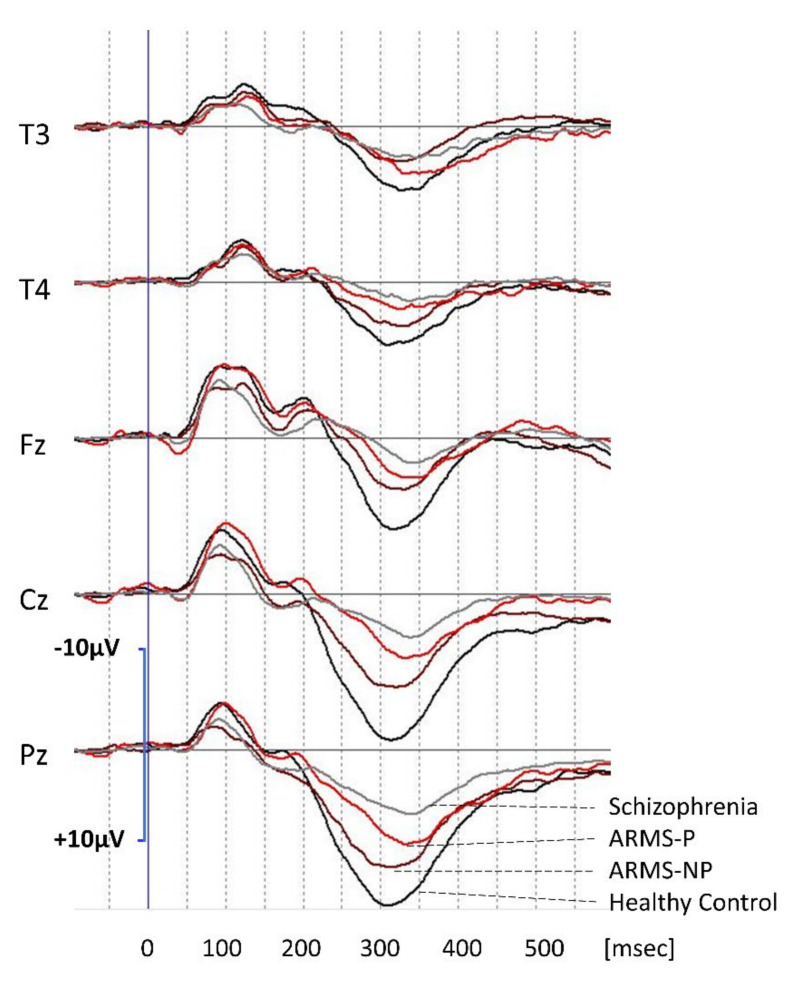
Figure 2.
P300 waveforms at the T3, T4, Fz, Cz, and Pz leads. Grand average waveforms for subjects with ARMS who later developed psychosis (ARMS-P; red lines) and those who did not (ARMS non-converters) (ARMS-NP; brown lines). For comparison, waveforms of healthy controls (black lines) and those of patients with schizophrenia (gray lines) are also shown.

