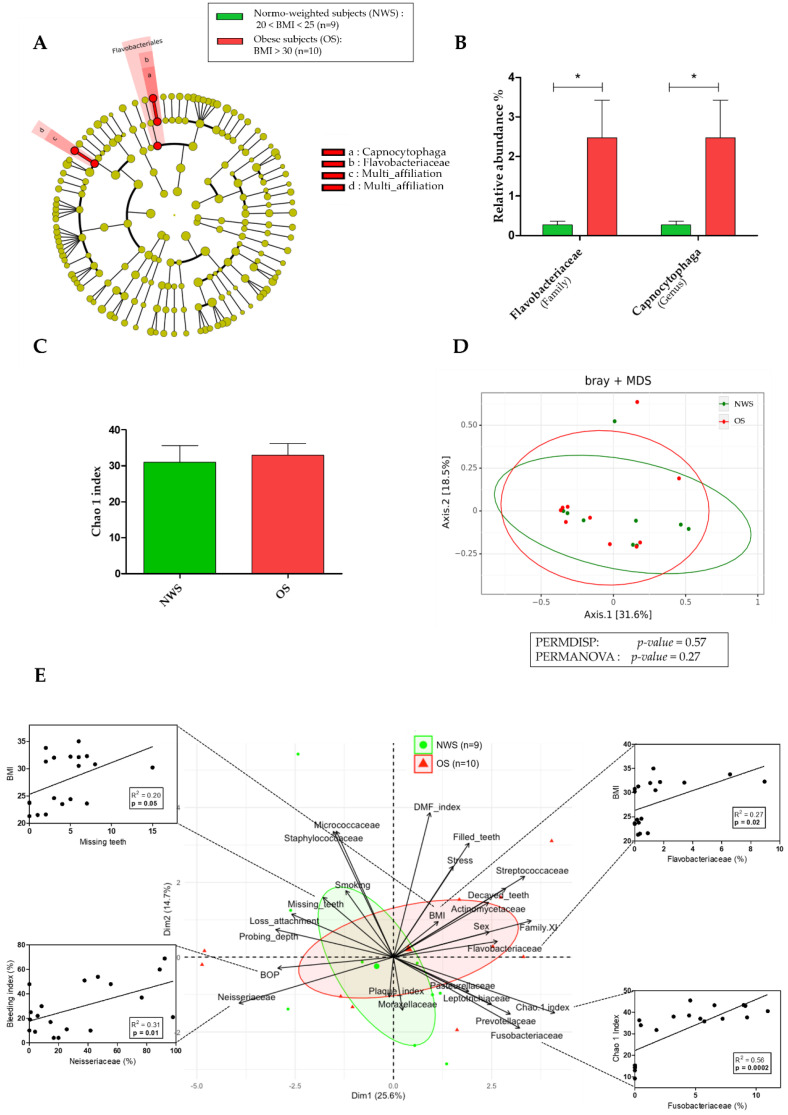
Figure 1.
Oral microbiota in obese subjects (OS; n = 10) compared to normo-weighted subjects (NWS; n = 9). (A) Linear discriminant analysis effect size (LEfSe) analysis-based cladogram for oral microbiota; (B) Relative abundance (%) for taxonomic family and genus, identified with significant differences in saliva microbiota; (C) Chao 1 index representation of alpha diversity; (D) Bray–Curtis index representation of the beta diversity between; (E) Principal Component Analysis (PCA) between dominant bacterial genera from oral microbiota and oral clinical parameters and Pearson’s correlation analysis. Data as mean ± SD, * p < 0.05, unpaired Mann–Whitney test.

