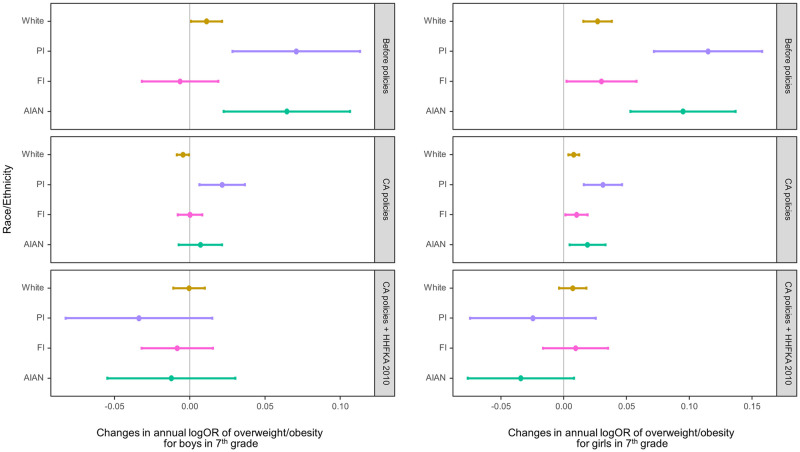
Fig 3. Adjusted change in the log odds of overweight/obesity per year within the periods 2002–2004 (baseline, no policies in effect), 2005–2012 (after CA policies and before HHFKA 2010), and 2013–2016 (CA policies plus HHFKA 2010) among seventh graders by sex.
The dots indicate the point estimates of the yearly changes in the log odds, and the whiskers show the 95% confidence intervals. AIAN, American Indian/Alaska Native; CA, California; FI, children of Filipino origin; HHFKA 2010, Healthy, Hunger-Free Kids Act of 2010; OR, odds ratio; PI, children of Pacific Islander origin; W, White.

