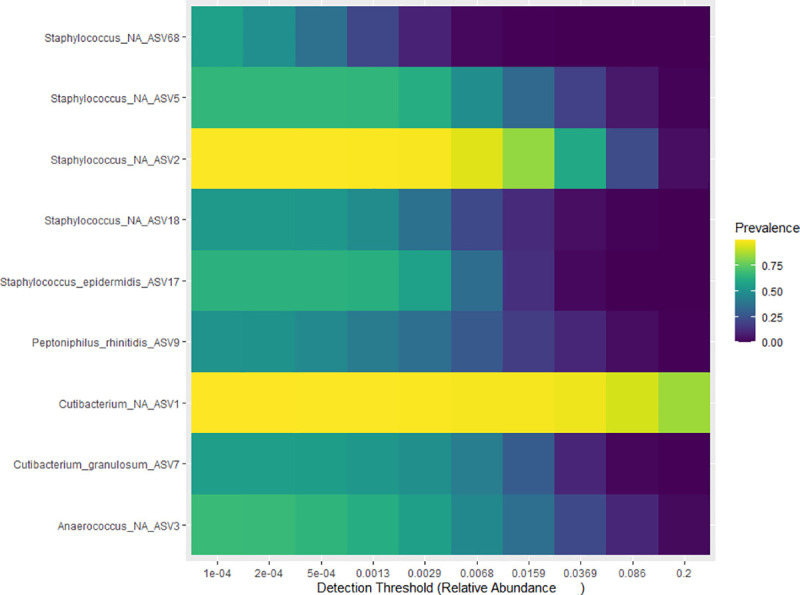
Fig 3. Heatmap plot of the most prevalent ASV identified in the sample.

Fig 3 presents the most prevalent ASVs (y-axis) identified at different detection thresholds (0.001 to 20%). Most common ASVs appear at low abundance per sample (0.01 to 1%).

Fig 3 presents the most prevalent ASVs (y-axis) identified at different detection thresholds (0.001 to 20%). Most common ASVs appear at low abundance per sample (0.01 to 1%).