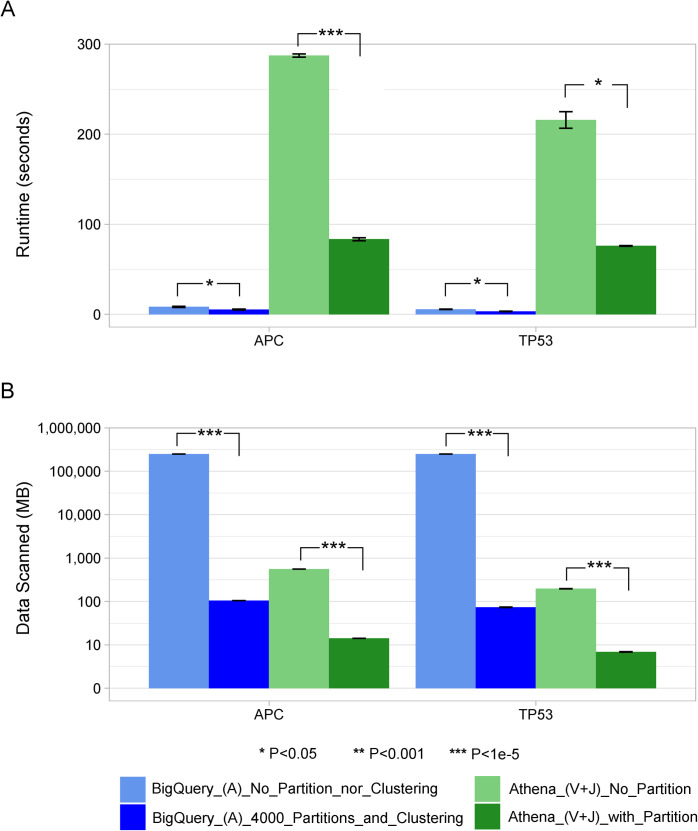
Fig 3. Runtime and the amount of data processed for annotating an input set of genes.
A, V and J stand for Annotation records, Variant records and Join table operations, respectively. Average values and standard deviations were plotted. (A) depicts the execution time in seconds for the two input genes. In this experiment, the annotation table was in BigQuery and the variant table in Athena. Therefore, Swarm first found all the annotation records in BigQuery that overlapped with the input gene regions, compressed them and moved them to Athena. Then, on the Athena side, Swarm decompressed the overlapping annotation data and created a temporary table, which was eventually processed to join with the existing variant table. The light blue and light green represent the configurations without any optimizations by partitioning or clustering, and the dark blue and dark green represent the configurations with optimizations. (B) shows the amount of data processed in megabytes, and the y-axis is logarithmic in scale. Significance differences between groups are indicated on top of the bars (two samples t-test). Note that for (A), differences between any BigQuery and Athena groups were highly significant (P < 1e-5), and for (B), differences within the BigQuery or Athena groups were also highly significant (P < 1e-5).

