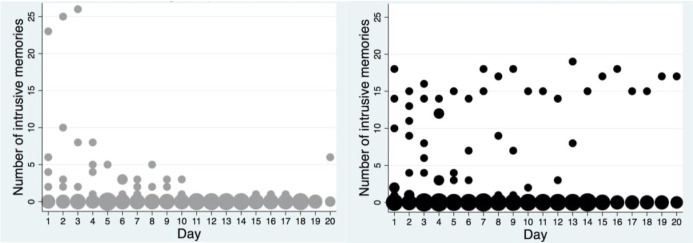
Fig 4. Frequency scatter graphs of the number of intrusive memories per day recorded in the intrusion diary during the intervention period for patients who returned the diary in each condition (the left graph depicts the PE group and the right the control condition).
The circle size illustrates the number of participants who reported the indicated number of intrusive memories for each day.

