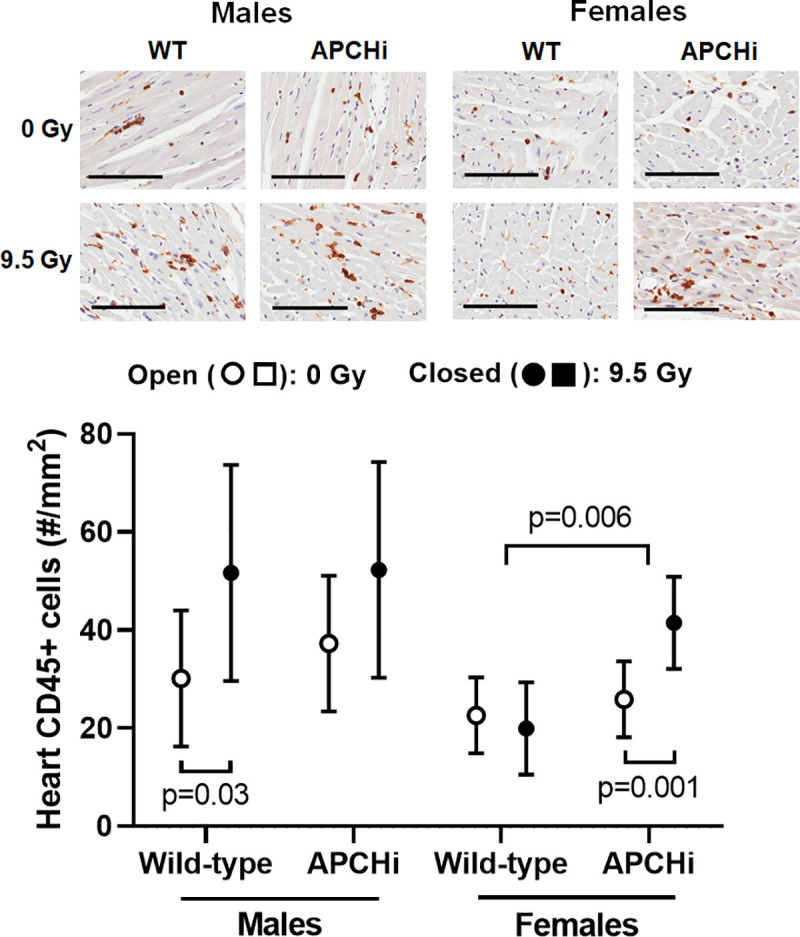
Fig 4. Cardiac numbers of CD45 positive cells at 6 months after irradiation.

Immunohistochemistry was used to visualize CD45 positive cells in the heart. Cell counts were obtained in both left and right ventricle and divided by total tissue area. Scale bars: 100 μm. Graph indicate means and SD of the statistical model; n = 7 wild-type males in 0 Gy, 8 wild-type males in 9.5 Gy, 8 APCHi males in 0 Gy, 8 APCHi males in 9.5 Gy, 8 wild-type females in 0 Gy, 8 wild-type females in 9.5 Gy, 8 APCHi females in 0 Gy, and 8 APCHi females in 9.5 Gy. Short brackets indicate significant differences between 0 Gy and 9.5 Gy. The wider bracket indicates that the effect of radiation in wild-type mice is significantly different from the effect of radiation in APCHi mice.
