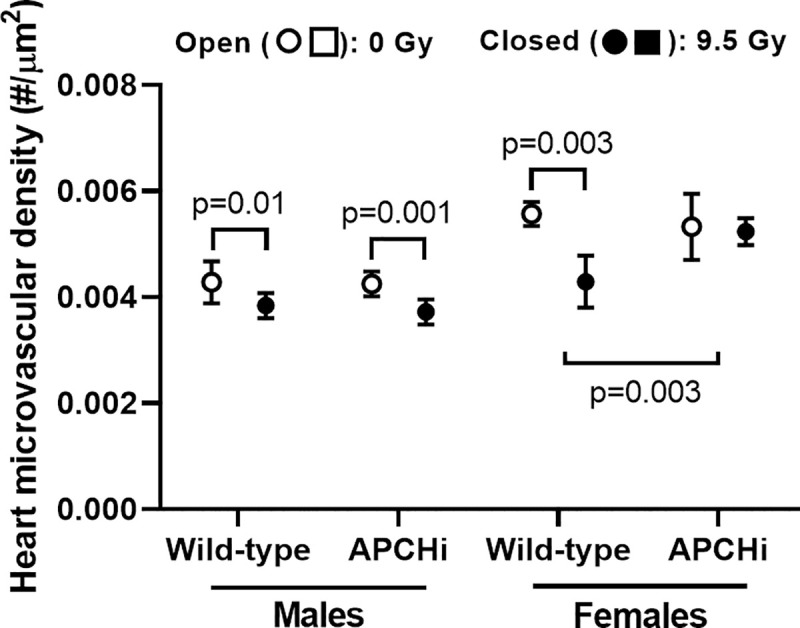
Fig 5. Heart microvascular density at 6 months after irradiation.

Lectin staining was used to visualize endothelial cells, and the number of capillaries in both left and right ventricles was determined per tissue area. Graphs indicate means and SD of the statistical model; n = 9 wild-type males in 0 Gy, 8 wild-type males in 9.5 Gy, 7 APCHi males in 0 Gy, 7 APCHi males in 9.5 Gy, 8 wild-type females in 0 Gy, 5 wild-type females in 9.5 Gy, 9 APCHi females in 0 Gy, and 8 APCHi females in 9.5 Gy. Short brackets indicate significant differences between 0 Gy and 9.5 Gy. The wider bracket indicates that the effect of radiation in wild-type mice is significantly different from the effect of radiation in APCHi mice.
