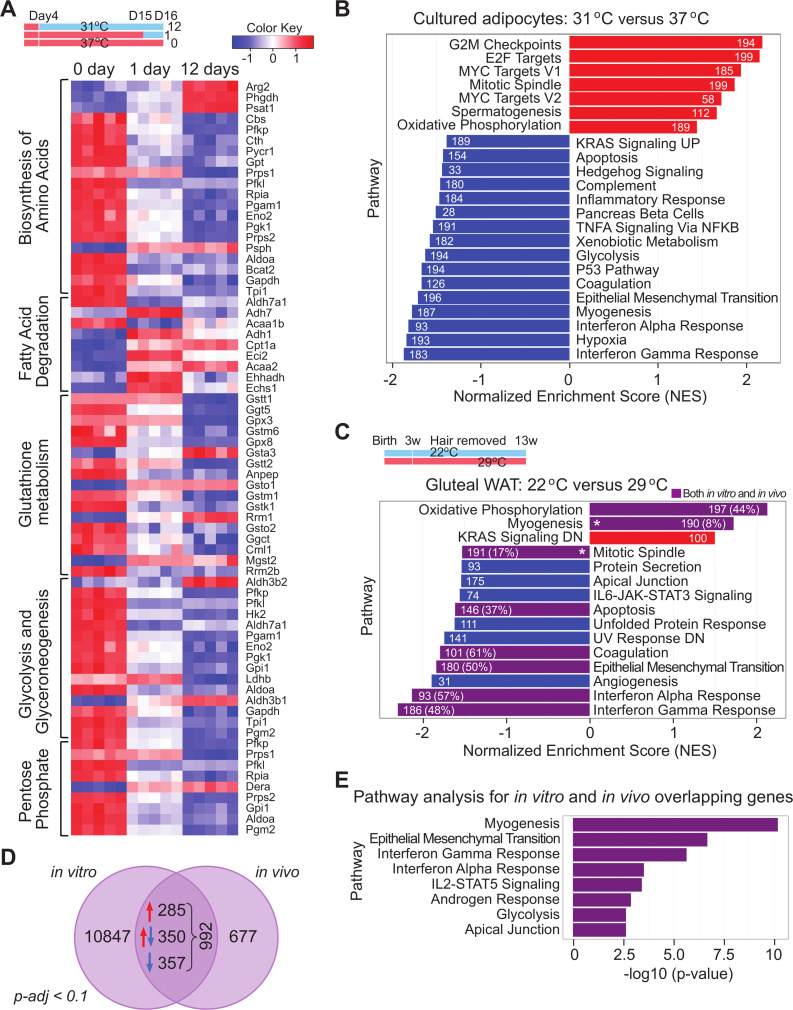
Fig 3. Exposure of adipocytes to 31°C activates an extensive transcriptomic program of adaptation.
(A, B) RNA from mature adipocytes at day 0, 1, and 12 of cool adaptation was purified and subjected to RNA-seq analyses (n = 5 per time point) (A). Heat map of select metabolic KEGG pathways significantly enriched by 1 or 12 days of cool temperature from iPathwayGuide pathway impact analysis. Enrichment was defined by a nominal p-value < 0.05 and FDR < 0.25. (B, C) Normalized score plots of enriched pathways from preranked GSEA comparing RNA expression in mature adipocytes exposed to 31°C vs. 37°C for 12 days (B), or in gluteal WAT of mice housed at 22°C vs. 29°C for 13 weeks, as described in Fig 1C (n = 6, 7) (C). Enriched pathways were defined by a nominal p-value < 0.05 and FDR < 0.05. p-Values were calculated from GSEA with 1,000 permutations. Numbers in the bars indicate gene set size. Purple bars indicate gene sets shared between datasets, and % indicates proportion of shared leading edge genes with the in vitro data. * indicate common pathways between the in vitro and in vivo data that are regulated in opposing directions. Data shown are from one experiment. (D) Venn diagram indicating the numbers of genes similarly regulated (P-adj < 0.1) in cultured adipocytes and gluteal WAT by cool temperatures. (E) Pathways identified by Enrichr software from genes regulated in both datasets. Numerical data for all graphs are provided in S3 Data. FDR, false discovery rate; GSEA, gene set enrichment analysis; RNA-seq, RNA sequencing; WAT, white adipose tissue.

