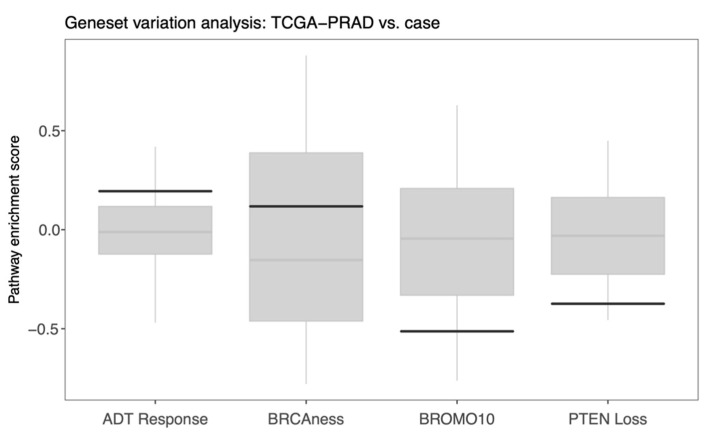
Figure 5.
Gene set variation analysis of gene signatures attributed to ADT response, HR deficiency/BRCAness, response to bromodomain inhibitors (BROMO10) and aberrant PTEN tumor-suppressor pathway activity. Signature enrichment scores were calculated for all the prostate adenocarcinoma samples in TCGA (Gleason score >= 8, n = 201). In the boxplots, scores for our case are indicated with solid black lines, and median scores in TCGA-PRAD are indicated with gray horizontal lines.

