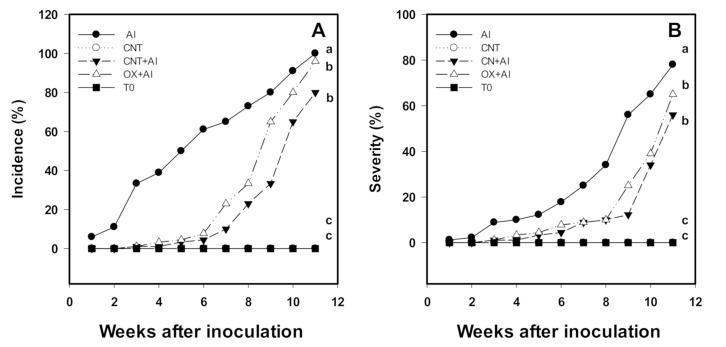
Figure 2.
Incidence (A) and severity (B) of A. solani in the tomato crop plants. Al: Positive control inoculated with A. solani; CNT: Carbon nanotubes; OX: Commercial control; T0: Control. Different letters indicate significant differences between treatments according to the least significant difference of Fisher test (α = 0.05). N = 5 ± standard error.

