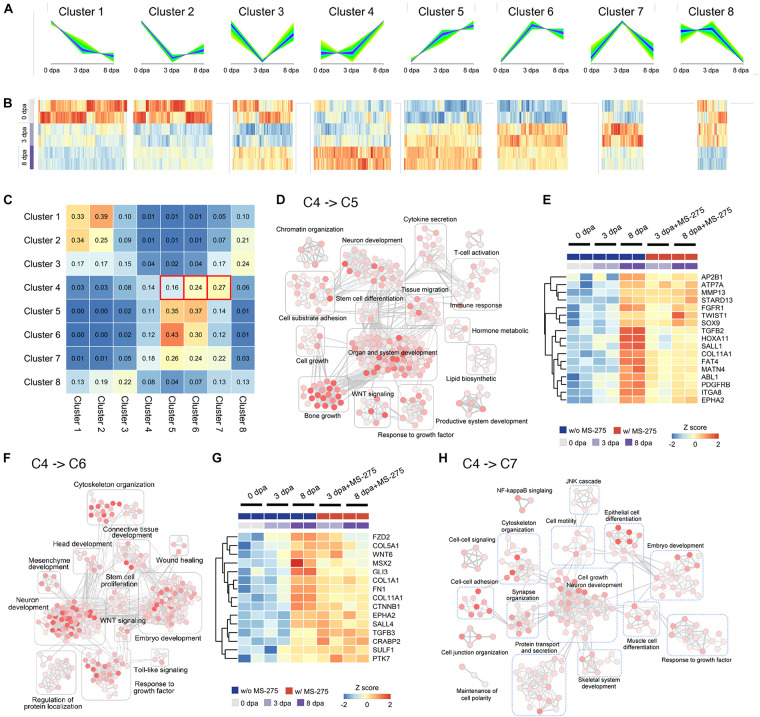
FIGURE 3.
HDAC1 inhibition induced changes in regeneration stage-associated gene expression trends and the associated Gene Ontology terms based on unsupervised transcript clustering. (A) Unsupervised clustering of transcripts based on the trends in their expression patterns during normal regeneration at 0, 3, and 8 dpa. (B) The heatmap of the relative expression level of transcripts associated with each cluster. Transcript datasets from the ST in each stage without MS-275 treatment are shown for comparison. (C) The cluster transition matrix shows the proportion of genes in each given cluster (row) that exhibited changes in their expression pattern to those of other clusters (column) after MS-275 treatment. (D) Enrichment maps of gene sets significantly enriched (FDR < 0.05) by genes whose expression transitioned from cluster 4 to cluster 5 after MS-275 exposure. (E) The heatmap shows the expression values of selected genes whose expression transitioned from cluster 4 to cluster 5 after MS-275 exposure. (F) Enrichment maps of gene sets significantly enriched (FDR < 0.05) by genes whose expression transitions from cluster 4 to cluster 6 after MS-275 exposure. (G) The heatmap shows the expression values of selected genes whose expression transitioned from cluster 4 to cluster 6 after MS-275 exposure. (H) Enrichment maps of gene sets significantly enriched (FDR < 0.05) by genes whose expression transitions from cluster 4 to cluster 7 after MS-275 exposure. The red to white color gradient for each GO node indicates the significance of the enrichment for that particular GO term (red being more significant).

