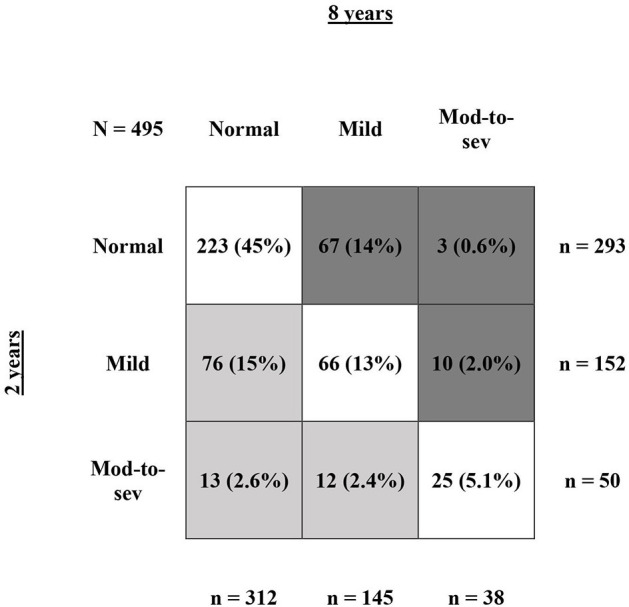
Figure 2.

Shifts in NDI from 2 to 8 years of age. This figure shows NDI rate at 2 vs. 8 years of age for infants with NDI calculation at all three follow-up contacts (N = 495). The numbers are presented as N (%), with the % calculated relatively to the full group of N = 495 infants. The row sums show the total number of infants at 2 years of age for normal, mild, and moderate-to-severe NDI. The column sums show the total number of infants at 8 years of age for normal, mild, and moderate-to-severe NDI. The dark gray boxes represent all infants that deteriorated toward a worse NDI category from 2 to 8 years, the light gray boxed represent all infants that improved toward a better NDI category from 2 to 8 years, and the white boxes represent all infants that remained in the same NDI category.
