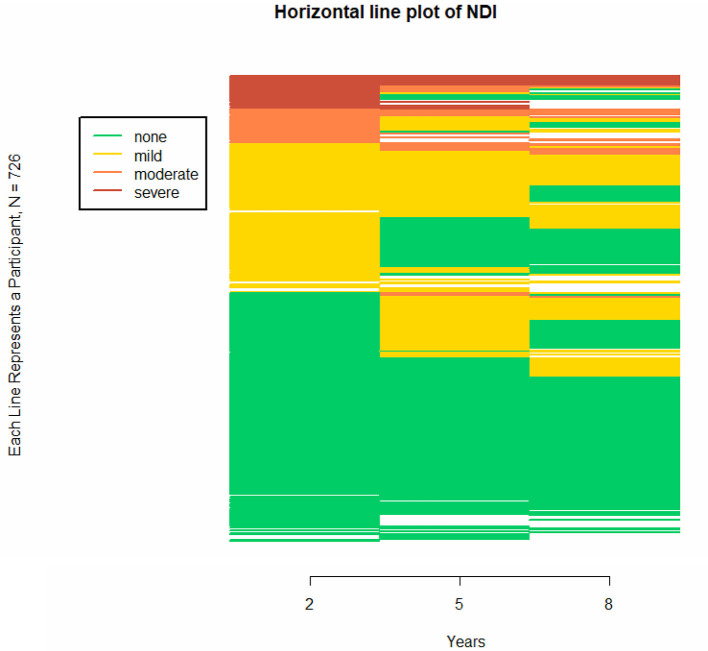
Figure 3.
Individual trajectories of neurodevelopmental impairment (NDI) at different ages, presented in a horizontal line plot for all children with follow-up. The horizontal line plot uses colors to differentiate between states on a categorical longitudinal variable for multiple participants. Because categorical data defines a specific state, a trajectory for a categorical variable becomes a sequence of states rather than a continuum. The figure consists of 726 stacked horizontal line, with each horizontal line representing a participant. In this figure, NDI category is presented at 2, 5, and 8 years of age. This figure shows overall patterns of increasing and decreasing trajectories, including patterns in missing data. The blank spaces indicate missing data for that follow-up age.

