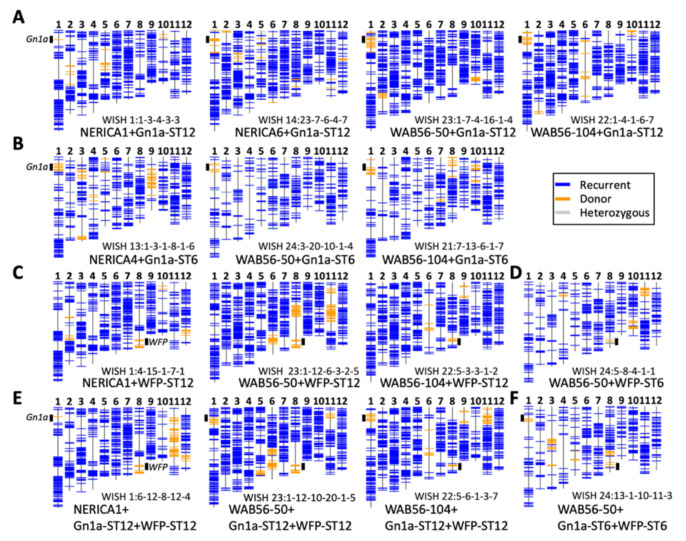
Figure 2.
Marker genotypes of the representative lines. Genotypes of GBS markers are represented with horizontal color lines. Chromosomes and marker positions are drawn to scale of physical lengths, and positions of Gn1a and WFP are shown in short bold black lines. (A) Selected lines with Gn1a-ST12, (B) selected lines with Gn1a-ST6, (C) selected lines with WFP-ST12, (D) selected lines with WFP-ST6, (E) selected lines with Gn1a-ST12 + WFP-ST12, (F) selected line with Gn1a-ST6 + WFP-ST6.

