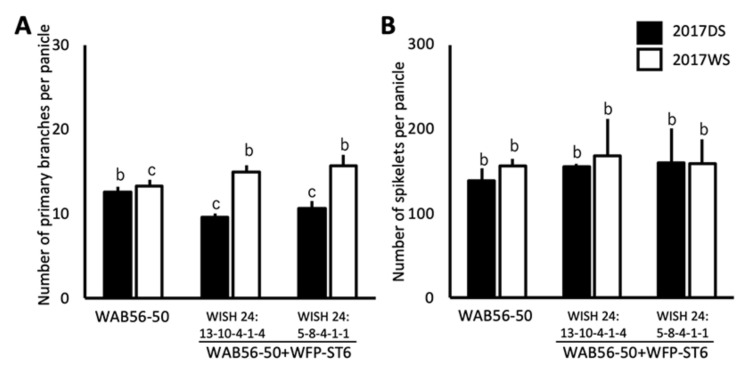
Figure 6.
Number of primary branches per panicle (A) and numbers of spikelets per panicle (B) (mean ± SD) of WFP-ST6 introgression lines in the genetic background of WAB56-50. Solid and white bars show the results in 2017DS and 2017WS, respectively. Different letters above the bar graphs indicate significant difference at p < 0.05.

