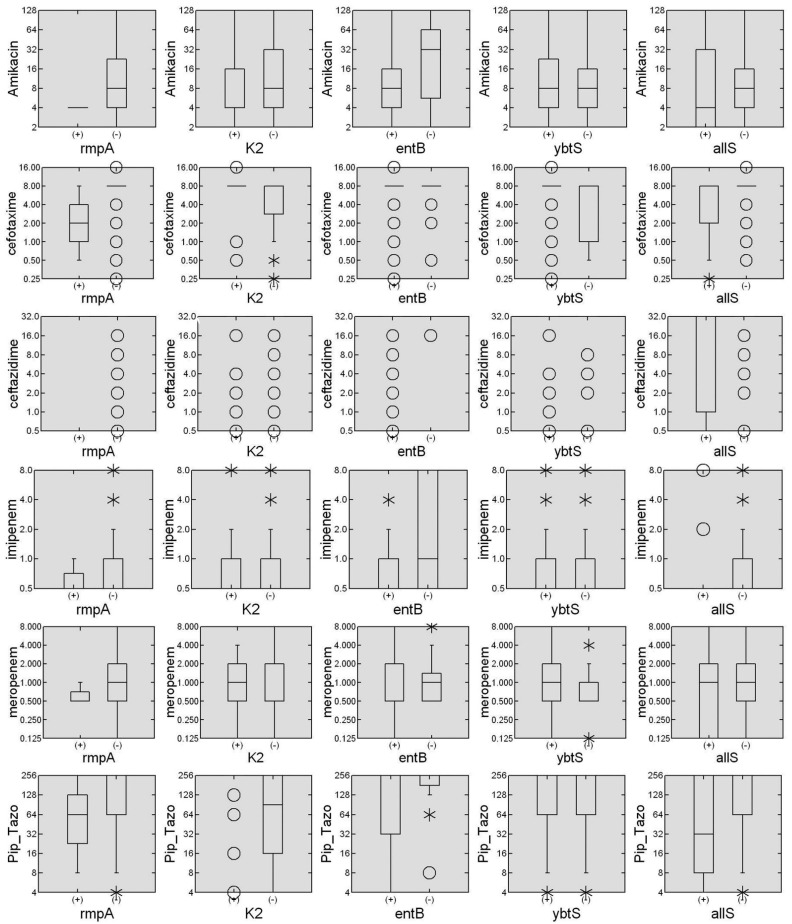
Figure 2.
Association of virulence genes in the measurement of median MIC. The box diagrams created with the Systat 13 software summarize the MIC measures for six commonly used antibiotics, stratified by the presence or absence of each of the six virulence genes. The data are presented as mg/L in a Log2 scale of MICs for each antibiotic stratified by the presence (+) or absence (−) of each virulence gene. The horizontal lines represent the median and the frequency limits between 25 and 75% of the individuals, the hollow dots represent single individuals, and the asterisks represent small groups of individuals.

