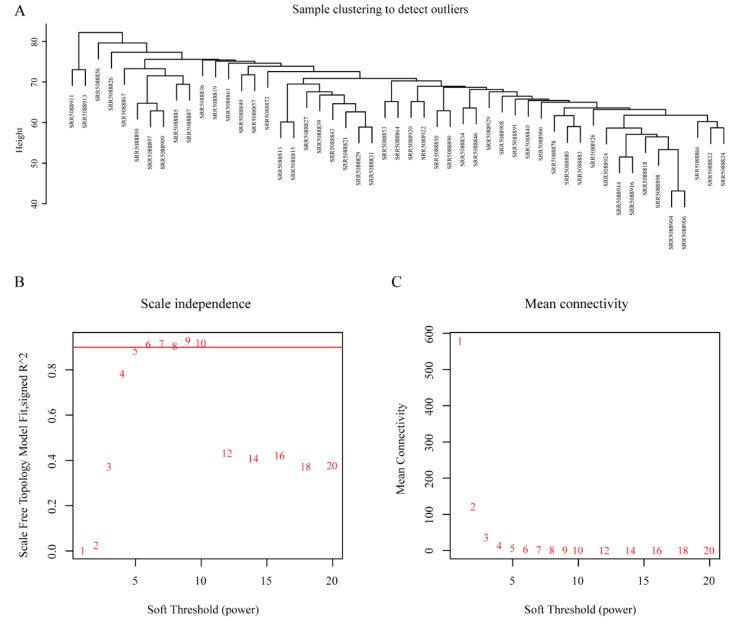
Figure 2.
Sample clustering dendrogram and determination of soft-thresholding power in weighted gene co-expression network analysis (WGCNA). (A) Sample clustering dendrogram to detect outliers. (B) Analysis of the scale-free fit index for various soft-thresholding power. (C) Analysis of the mean connectivity for various soft-thresholding powers.

