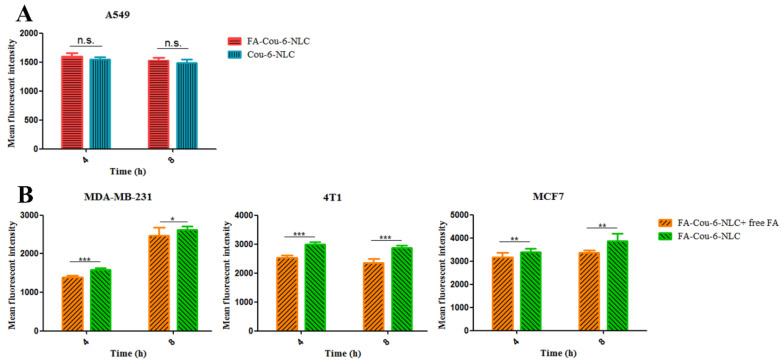
Figure 4.
(A) The cellular fluorescence intensity of Cou-6-NLC and FA modified Cou-6-NLC at different incubation time intervals (4 h, 8 h) in A549 cells. (B) Blocking experiment after pretreatment with excess FA. * p < 0.05; ** p < 0.01; *** p < 0.001; n.s., not significant. Results are expressed as mean ± SD, n = 3.

