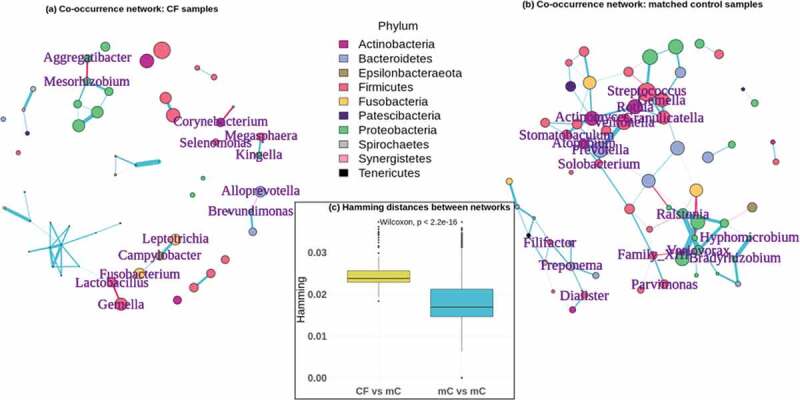
Figure 2.

Networks of co-occurring taxa differ significantly between cystic fibrosis and matched control samples. Co-occurrence networks of taxa in (a) the 31 CF samples and (b) all 352 matched control samples. Only those vertices representing taxa mentioned in the text are labeled, as these were the relevant connections that differed between CF and controls. Vertices are colored by the phylum to which they belong. Vertex sizes are proportional to the abundances of those taxa. Edges are colored according to the trend of the association between indicated taxa, where blue edges are positive and red edges are negative. Edge widths are proportional to the strength of the associations. For the matched control network in (b), this comes from a network calculated for all 352 controls together, merely for the sake of visualization. All statistics included in the text are based on the networks from the 100 matched control sub-samples. (c) Distributions of Hamming distances between the CF network and the 100 matched control networks (CF vs mC – yellow) and between each of the matched control networks (mC vs mC – blue). The p-value indicates the significance of the difference between these distributions
