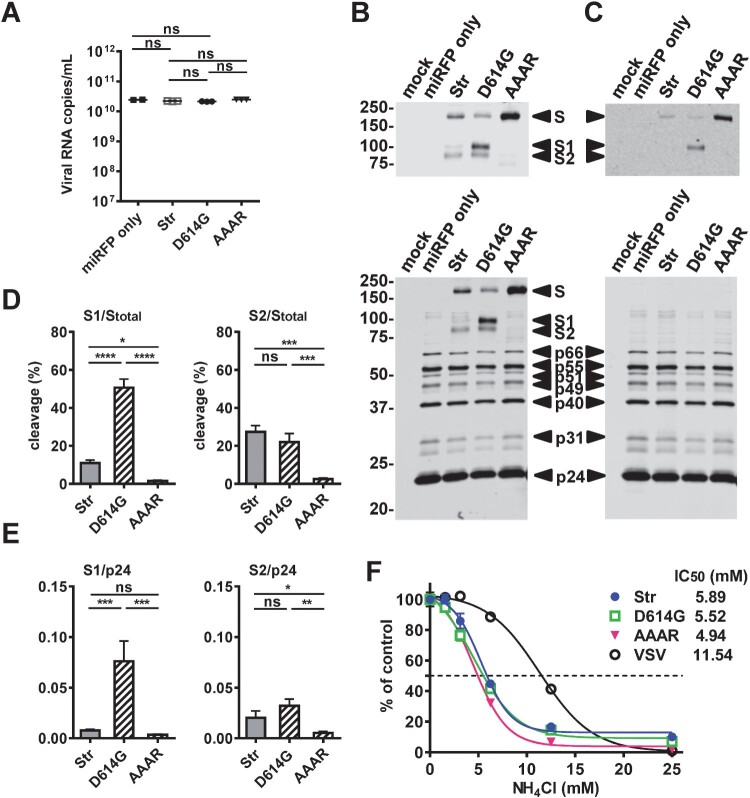
Figure 3.
Characterization of SARS-CoV-2 pseudoviruses with miRFP reporter. (A) Quantification of viral RNA copies of three pseudoviruses (Str, D614G, AAAR) and miRFP vector only by qRT-PCR with primers targeting the HIV-1 pol gene. Data are means and standard deviations of 3 experiments. ns, not significant by Mann-Whitney test (GraphPad 6.0). (B,C) Western blot analysis of three pseudovirus particles (Str, D614G, AAAR) and miRFP vector only purified from sucrose cushion ultracentrifugation using HIV-1 positive sera (B,C bottom) and rabbit sera to S protein (B top) and a human mAb CR3022 to RBD (C top) of SARS-CoV-1. Gels are from one representative experiment of three. (D,E) Percentage of cleavage based on the ratio of the intensity of S2 or S1 protein band to that of total S protein (D) and the ratio of the intensity of S2 or S1 protein to p24 (E) quantified by Li-Cor Odyssey classic imager (LiCor Biosciences) with Image Studio software. Data are means and standard of 3 experiments. **** P < 0.0001, *** P < 0.001, * P = 0.014 by one-way ANONA (GraphPad 6.0). (F) HEK-293T-hACE cells (2 × 10⁴ cells/well) were seeded onto 96-well plates and pretreated with 100 µl of serial 2-fold dilutions of NH4Cl (25–1.6 mM) at 37°C for 1 h, followed by spin infection with pseudoviruses prepared in fresh media containing NH4Cl (25–1.6 mM). The plate was incubated at 37°C for 18 h before replacing with fresh media and miRFP signals were quantified at 48 h post-infection. Data are means and standard deviations of triplicates from one representative experiments of two.

