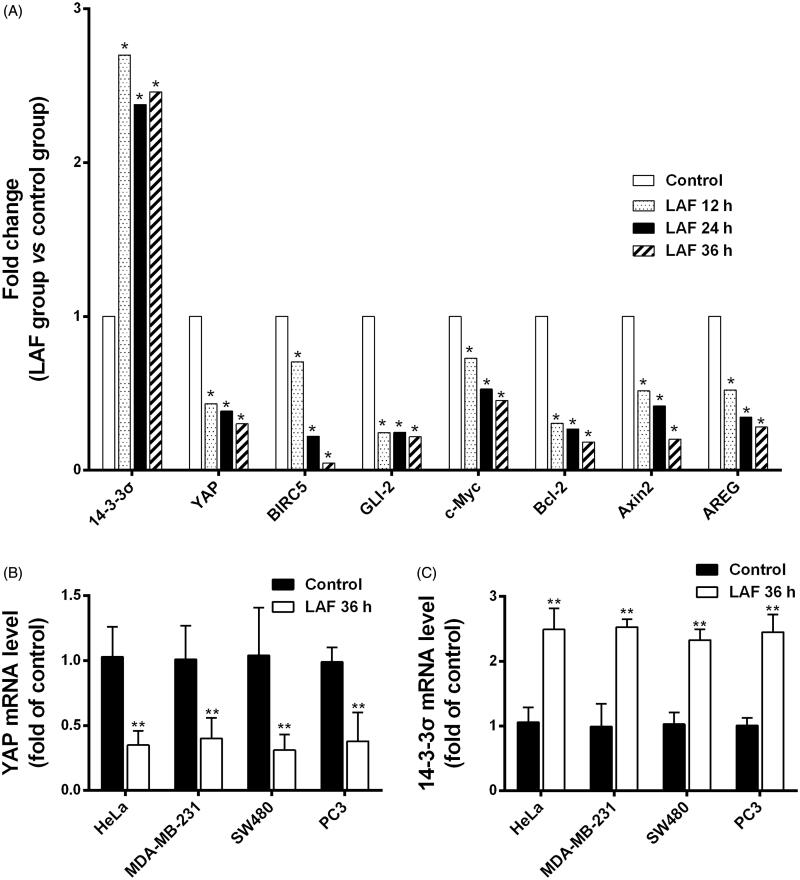
Figure 3.
Patterns of mRNA level changes in the Hippo signalling pathway induced by Lappaol F (LAF). For transcriptome analysis, SW480 cells were treated with 50 µmol/L LAF for 12, 24 or 36 h. For quantitative RT-PCR, cancer cells (HeLa, MDA-MB-231, SW480 and PC3) were treated with 50 µmol/L LAF for 36 h. (A) Differentially expressed genes (fold change ≥ 2 and false discovery rate < 0.01) involved in the Hippo pathway. (B) YAP mRNA levels measured by quantitative RT-PCR. (C) 14-3-3σ mRNA levels measured by quantitative RT-PCR. All data are expressed as the mean ± SD (transcriptomic analysis, n = 3; quantitative RT-PCR, n = 6). **p < 0.01, significantly different from the control without LAF treatment. AREG: amphiregulin; Axin2: axis inhibition protein 2; Bcl-2: B cell lymphoma/leukemia-2; BIRC5: survivin/baculoviral IAP repeat containing 5; c-Myc: cellular myelocytomatosis oncogene; GLI2: glioma-associated oncogene family zinc finger 2; YAP: Yes-associated protein.

