
Fig. 2.
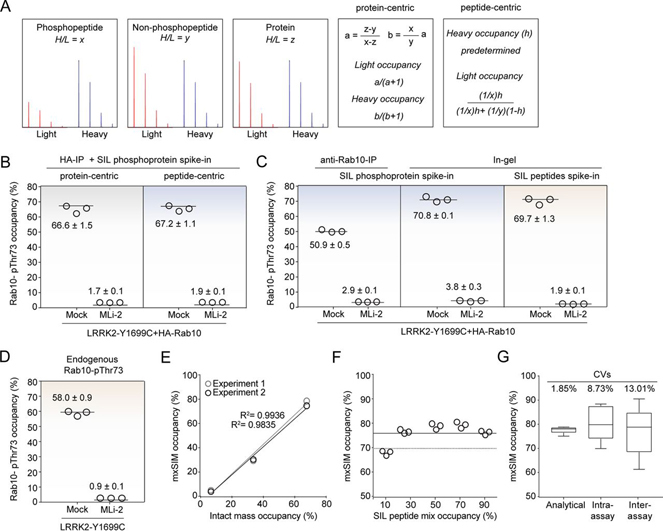
mxSIM accurately determines Rab10-Thr73 phosphorylation stoichiometry.A, Heavy-to-light ratios and the formulas used for protein- and peptide-centric approaches. B, HA-Rab10-pThr73 occupancy in LRRK2-Y1699C-expressing HEK293 cells was determined using the protein- versus peptide-centric approaches after HA-IP. C, HA-Rab10-pThr73 occupancy determined using the peptide-centric approach with either SIL phosphoprotein or SIL peptide standard spike-in after enrichment by anti-Rab10-IP or SDS-PAGE followed by in-gel digestion in HEK293 cells expressing LRRK2-Y1699C (−/+ 200 nm MLi-2, 60 min). D, Endogenous Rab10-pThr73 occupancy determined using SIL peptide standards in mock and LRRK2-Y1699C expressing HEK293 cells (−/+ 200 nm MLi-2, 60 min). Samples from (B), (C), and (D) were analyzed in triplicates using the mxSIM method and the phosphorylation occupancies are presented as means ± SEM. E, Benchmarking our method using Thr73-phosphorylated unlabeled recombinant Rab10 proteins (1-175 aa) as standards. Correlation of the median occupancies determined either by intact mass analysis or by mxSIM in triplicates for two independent experiments. F, SIL phosphorylated and nonphosphorylated Rab10 peptides mixed to mimic 10, 30, 50, 70, and 90% occupancies and spiked into the digested recombinant pRab10 protein were measured using our mxSIM method in triplicates. The solid line represents the median occupancy (75.4 ± 1.5%) whereas the dashed line shows the estimated phosphorylation occupancy of the standard protein (70%) by intact mass analysis. G, CVs were calculated by repeating MS measurements (analytical), the workflow in the same gel (intra-assay) or in different gels (inter-assay) using the same phosphoprotein standard (n = 6).