
Fig. 3.
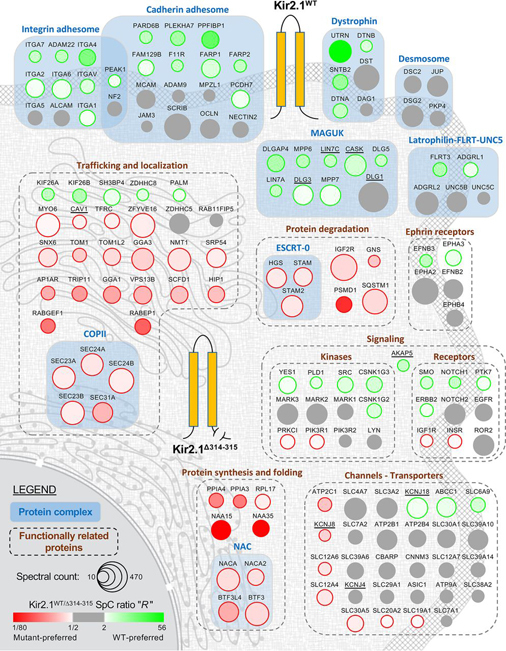
Graphical representation of the Kir2.1 BioID interactome. Protein complexes and groups of functionally related proteins encompassing 152 out of the 218 high-confidence Kir2.1 BioID hits are depicted in a cell. Major organelles in the cell (nucleus, endoplasmic reticulum, Golgi apparatus and cytoplasmic membrane) are shown (light gray) in the background to roughly indicate the approximate subcellular localization of the proteins in the cell. The Kir2.1WT-preferred interactors, Kir2.1Δ314-315-preferred interactors and Kir2.1WT/Δ314-315-neutral interactors are represented as green, red and gray circles, respectively. The color intensity of each circle is an indicator of the strength of the normalized Kir2.1WT/Δ314-315 SpC ratio “R” value. The size of each circle represents the average SpC counts observed in either the Kir2.1WT or Kir2.1Δ314-315 BioID experiment (whichever is the largest is represented in the figure).