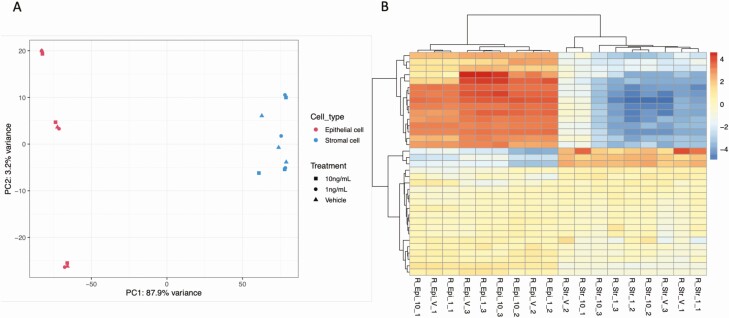
Figure 6.
(A) Principal component analysis (PCA) plot of overall transcriptional profile determined via RNA sequencing of bovine endometrial epithelial and stromal cells exposed to either vehicle control, 1 ng/mL, or 10 ng/mL of Insulin for 72 hour under flow (n = 3 biological replicates). Epithelial (left hand side) and stromal cells (right hand side) clustered into 2 distinct populations. (B) Heatmap showing the transcript expression for individual samples with lower levels (blue) and those with higher expression shown in red. Samples from epithelial cells (n = 9) and samples from stromal cells (n = 9) are arranged from left to the right.

