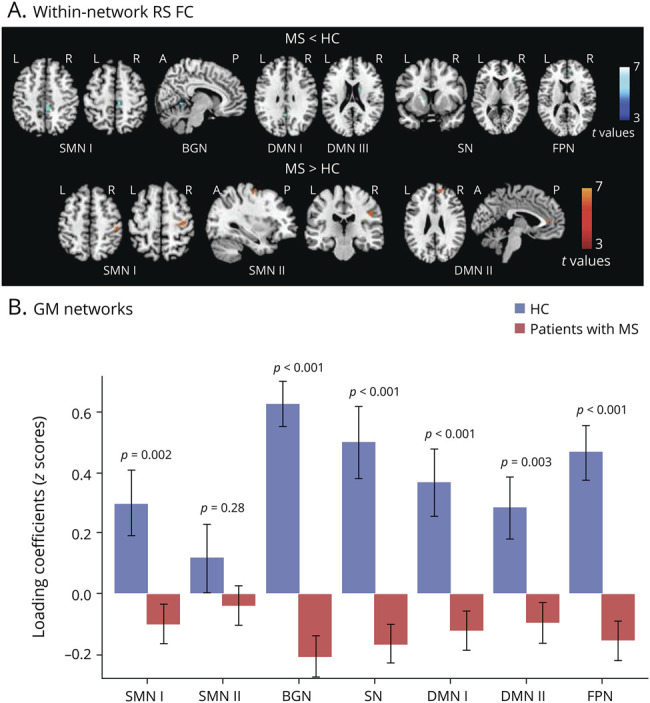
Figure 2. Between-Group Comparison of Functional and Structural Networks Between HC and MS.

(A) Voxel-wise between-group comparisons of RS FC: the blue–light blue color scale shows decreased RS FC in MS vs HC, whereas the red-yellow color scale shows increased RS FC in MS vs HC (age- and sex-adjusted 2-sample t test, p < 0.001 uncorrected for illustrative purposes). (B) Boxplots showing average loading coefficients (means and SDs) of relevant GM networks. MS = multiple sclerosis; FC = functional connectivity; GM = gray matter; HC = healthy controls.
