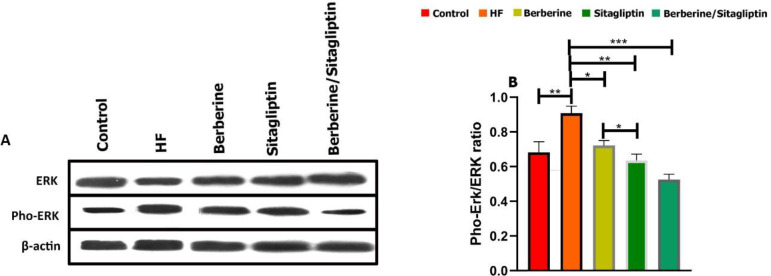
Figure 6.
Western blots for ERK and Pho-ERK in rat liver tissue lysate. Western blot images (A) and relative expression of Proteins (B). The percentage area under the curve of each protein band was divided by the percentage area under the curve of the corresponding β-actin band, and the normalized data were statistically compared between groups. Data are expressed as mean±SD. (three independent experiments were performed in triplicate). *P<0.05. **P<0.01, ***P<0.001. (one-way ANOVA with Tukey’s post hoc test)
ERK: extracellular signal-regulated kinase

