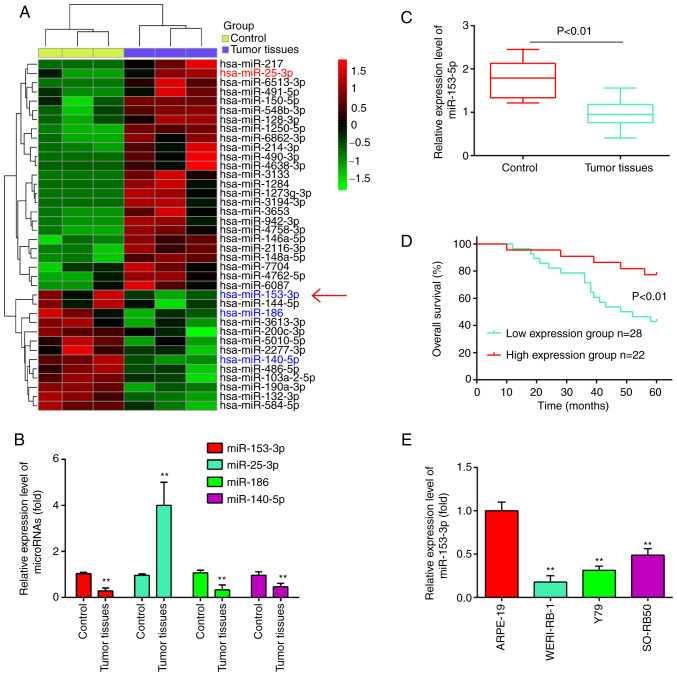
Figure 1.
miR-153-3p is downregulated in human RB tissues and cell lines. (A) Heatmap of miRNA expression was created using a method of hierarchical clustering by GeneSpring GX, version 7.3. Rows represent groups and columns represent miRNAs. The color key indicates the miRNA expression value; green indicates low expression levels, while red indicates high expression levels. (B) Relative expression of miR-25-3p, miR-186 miR-140-5p and miR-153-3p in the RB tissues. The results (mean ± SD) are from three independent experiments (**P<0.01 vs. control group). (C) Relative expression of miR-153-3p in 50 human RB tissues and 10 normal retinal tissues. (D) Overall survival was compared between patients with RB with low expression level of miR-153-3p and those with a high level of miR-153-3p. (E) Relative expression of miR-153-3p in RB cells and ARPE-19 cells. **P<0.01 vs. control or ARPE-19 cells. RB, retinoblastoma.

