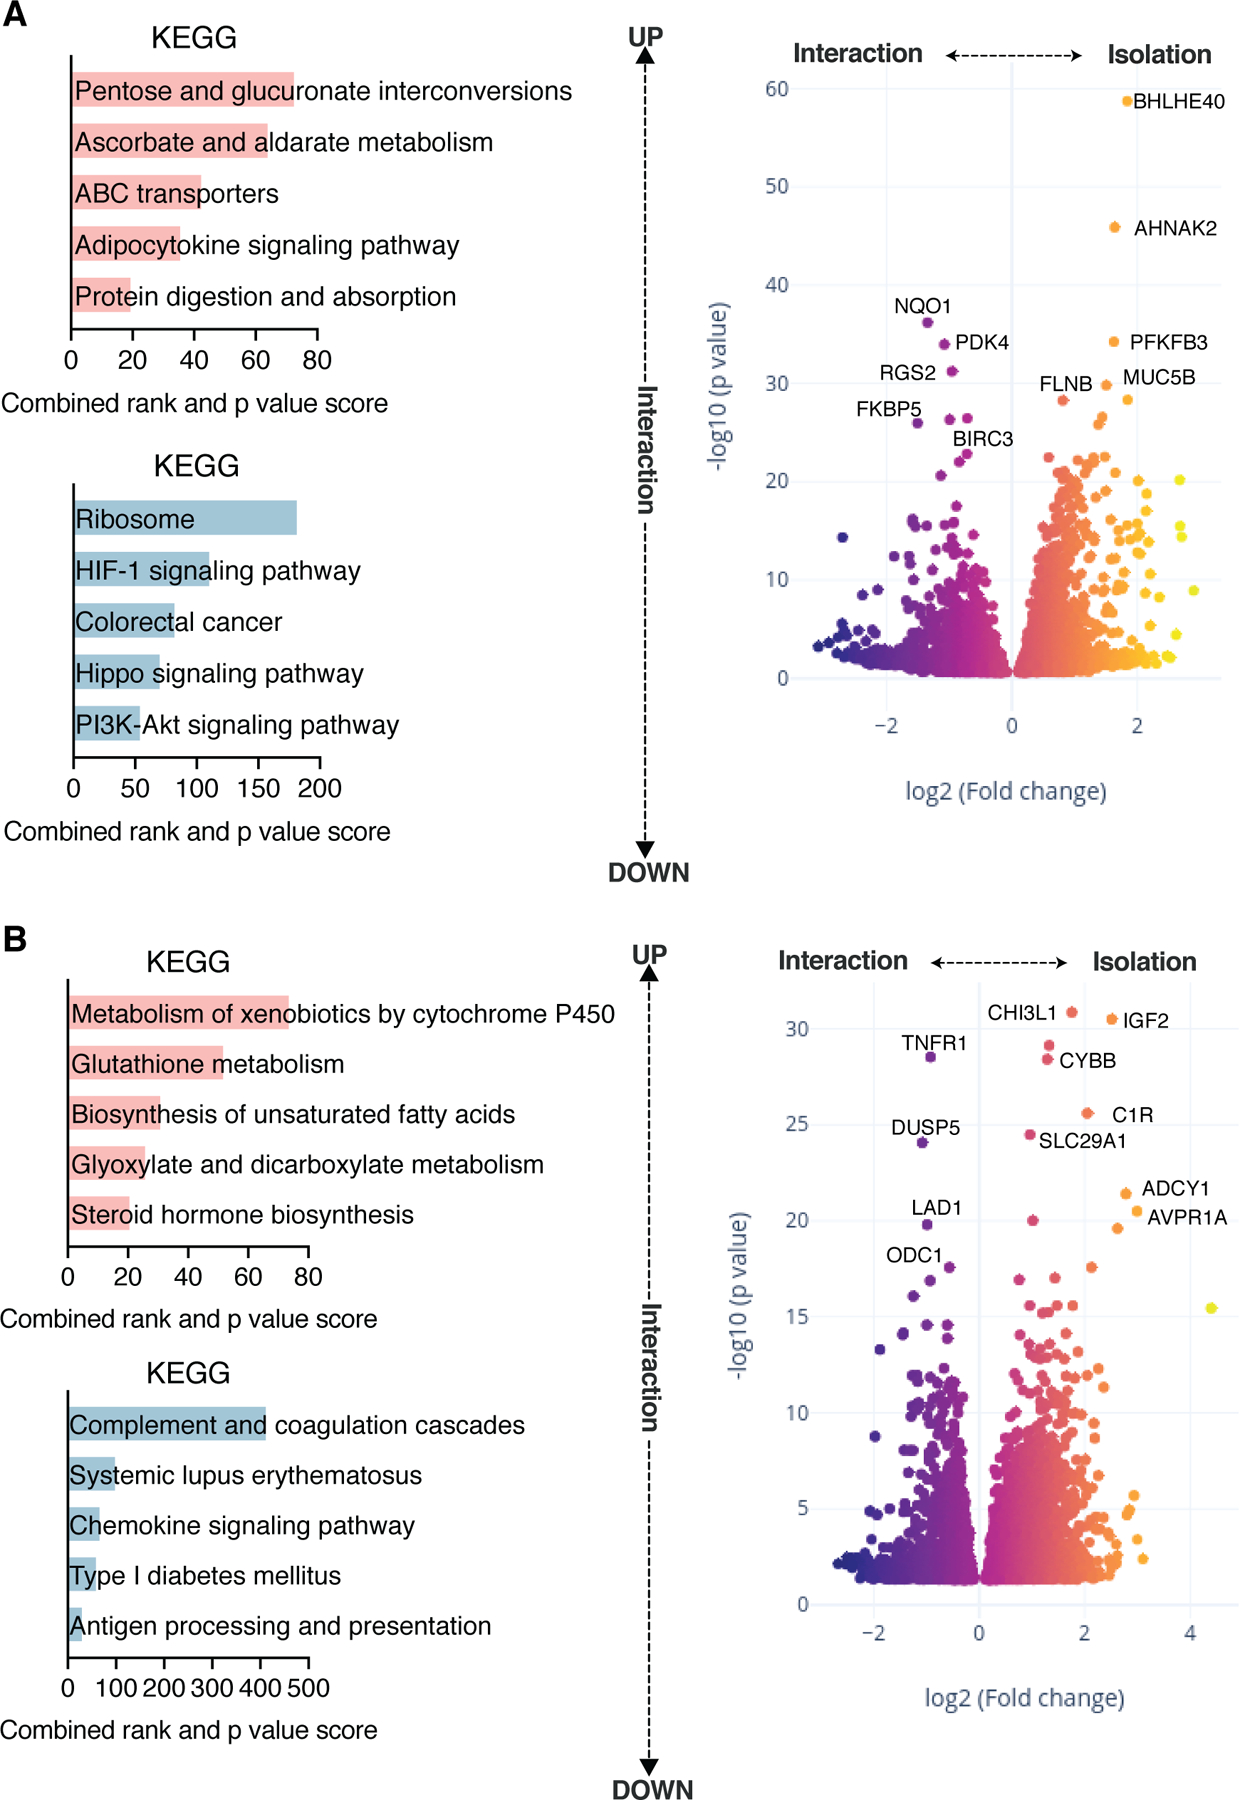
Fig.3. The integration of UC gut and liver MPS under fluidic communication significantly affects their individual phenotype and gene expression.

(A) DEG in UC gut MPS in isolation or in interaction with the liver MPS was assessed. Left: Upregulated (top) and downregulated (bottom) pathway enrichments based on KEGG in the gut MPS during interaction with the liver MPS. Right: Volcano plot showing DEG comparing gut MPSs in interaction with the liver MPS or in isolation. (B) DEG in liver MPS in isolation or in interaction with the UC gut MPS. Left: Upregulated (top) and downregulated (bottom) pathway enrichments based on KEGG in the liver MPS during interaction with MPS of the gut. Right: Volcano plot showing DEG comparing liver MPSs in interaction with the gut MPS or in isolation. Data represents 3 biological replicates.
