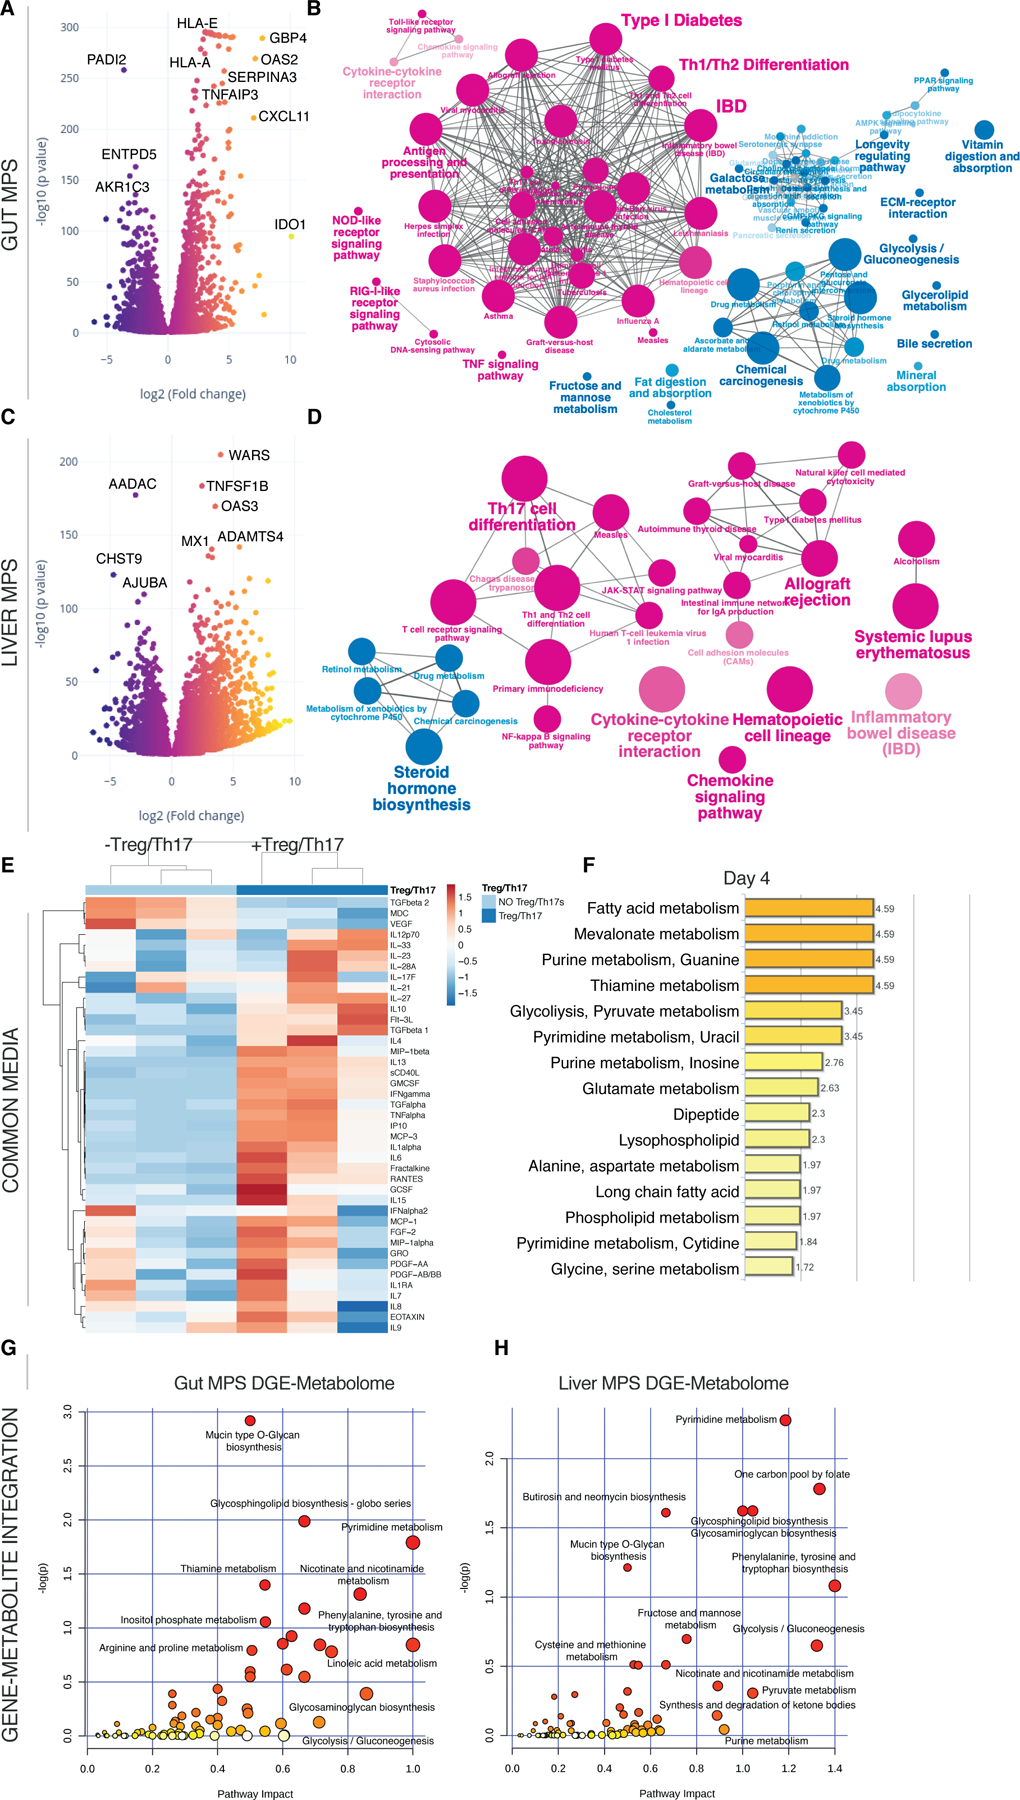
Fig.5. Inclusion of Treg/Th17 cells in the UC gut-liver MPS interaction leads to their conversion into inflammatory Th1/Th2 cells.

(A, C) Volcano plots of DEG in the gut MPSs (A) during interaction with the liver MPSs (C) in presence or absence of Treg/Th17 cells. (B, D) Network of enriched (magenta) and downregulated (blue) pathways based on KEGG in gut MPSs (B) or liver MPSs (D). (E) Clustered heatmap of multiplexed cytokines/chemokines present in circulating common media at day 4 during gut-liver MPS interaction +/- Treg/Th17 cells. (F) Significantly enriched metabolic pathways based on quantification of metabolites found in the common medium at day 4 of gut-liver-Treg/Th17 interactions. (G,H) Integration of significantly upregulated genes in the UC gut MPSs (G) or liver MPSs (H) during interaction with Treg/Th17 cells and enriched metabolites found in the common medium at day 4. Pathway impact score is shown on the x-axis and statistical significance on the y-axis. All data are derived from 3 biological replicates.
