
Fig.6. T cell mediated inflammation and tissue injury are significantly exacerbated by SCFA.
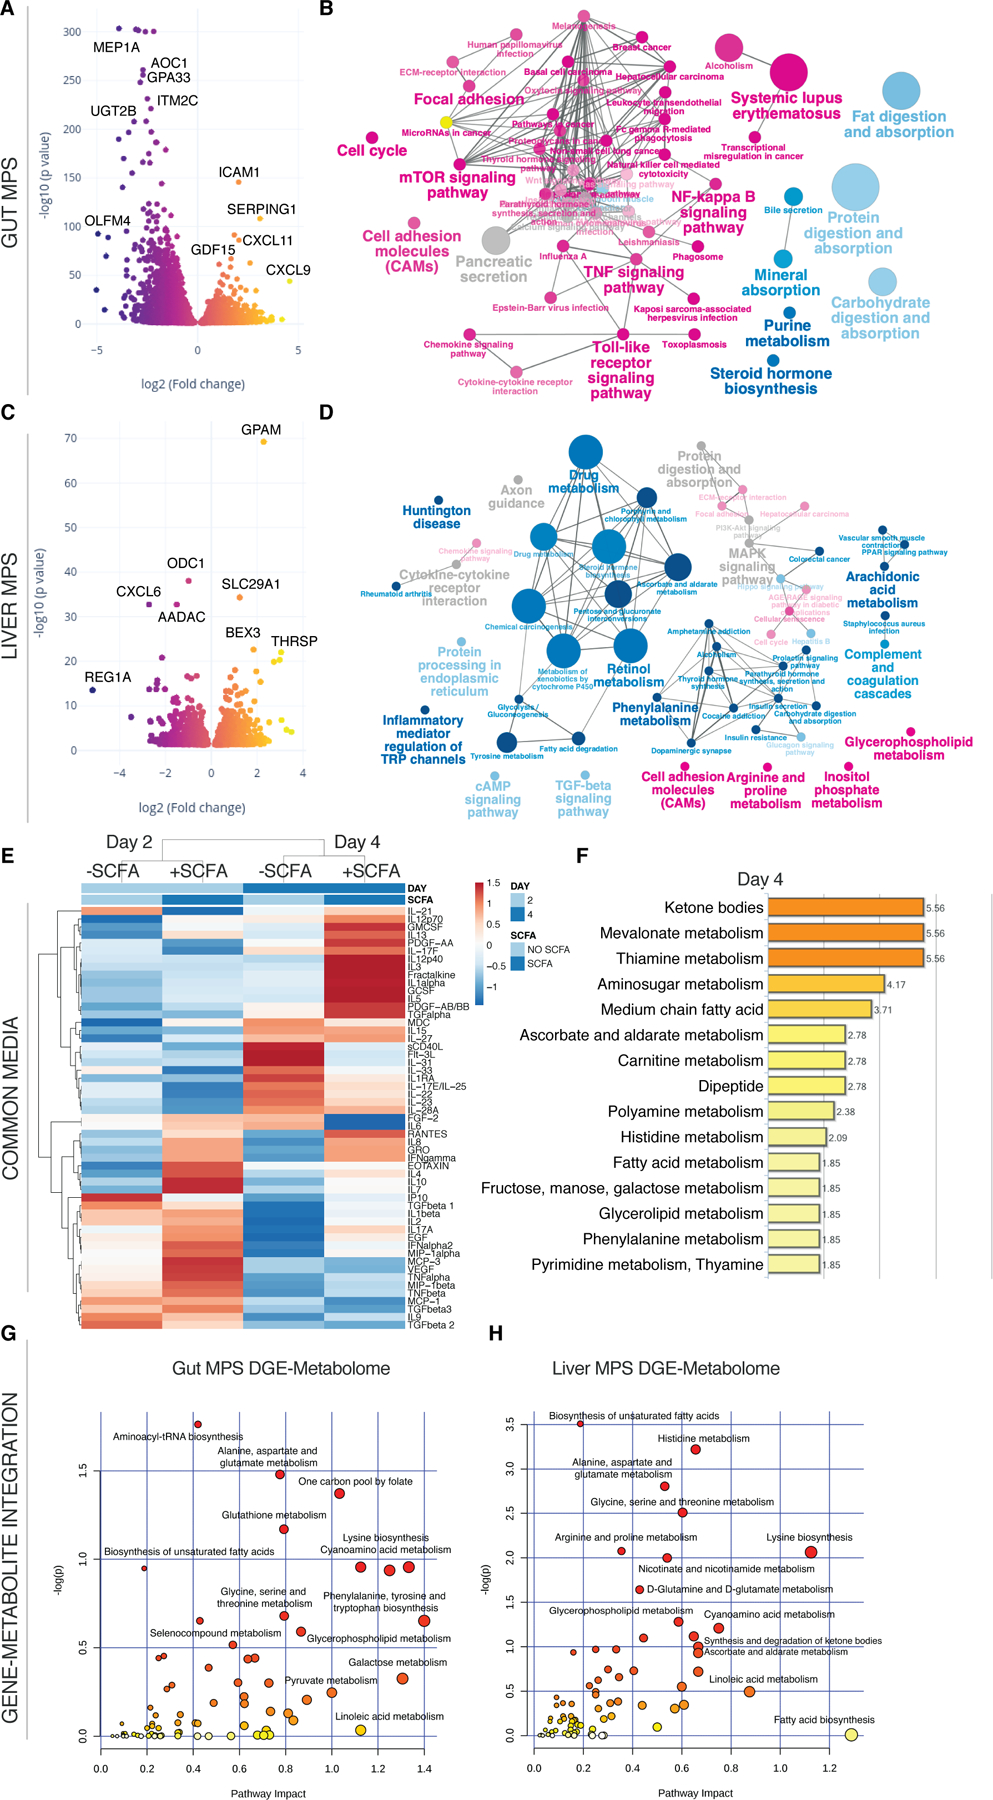
(A,C) Volcano plots of DEG in the gut MPSs (A) during interaction with the liver MPSs (C) and Treg/Th17 cells in presence or absence of SCFA. (B,D) Network of enriched (magenta) and downregulated (blue) pathways based on KEGG in gut MPSs (B) or liver MPSs (D). (E) Clustered heatmap of multiplexed cytokines/chemokines present in circulating common media at day 2 and 4 during gut-liver MPS interaction +/- SCFA. For actual concentrations of measured proteins and their importance consult Fig.S6. (F) Significantly enriched metabolic pathways based on quantification of metabolites found in the common medium at days 2 and 4 of gut-liver-SCFA interactions. (G,H) Integration of significantly upregulated genes in the UC gut MPSs (G) or liver MPSs (H) during interaction with Treg/Th17 cells and SCFA, and enriched metabolites found in the common medium at day 4. Pathway impact score is shown on the xaxis and statistical significance on the y-axis. All data represents 3 biological replicates.