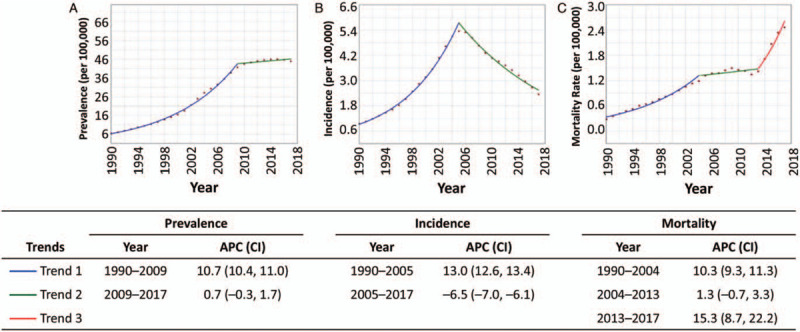
Figure 2.

Trends in HIV/AIDS prevalence (A), incidence (B), and mortality rate (C) in China, 1990 to 2017, from the GBD, Injuries, and Risk Factors Study 2017 data. APC was significantly different from 0 at the α = 0.05 level for trend 1 (blue) prevalence (A), trend 1 (blue) and trend 2 (green) for incidence (B), and trend 1 (blue) and trend 3 (red) for mortality (C). APC: Annual percentage change; CI: Confidence interval; GBD: Global Burden of Diseases; HIV/AIDS: Human immunodeficiency virus/acquired immunodeficiency syndrome.
