
Figure 1.
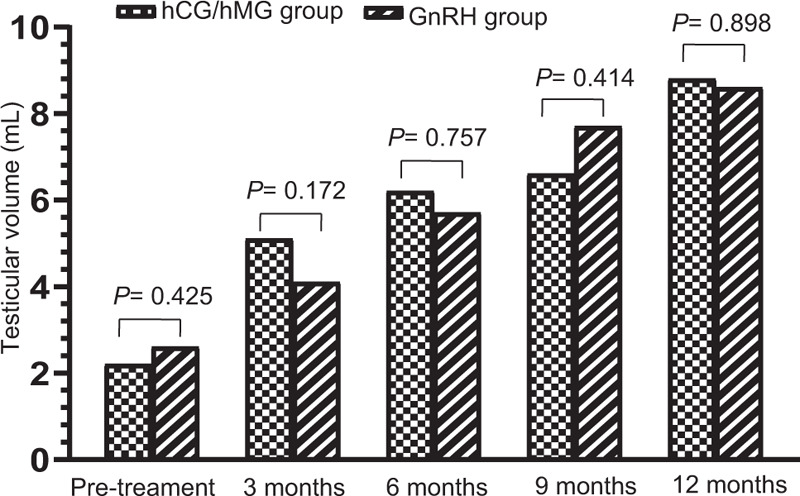
Alteration of TV during 0 to 12 months of treatment. The TV of hCG/hMG and GnRH patients at various time intervals (months) after treatment onset. Bars represent mean ± standard deviation. The P value of the comparison at each time point is displayed at the top of the corresponding pairs of bars. GnRH: Gonadotropin-releasing hormone; H: Height; hCG: Human chorionic gonadotropin; hMG: Human menopausal gonadotropin; TV: Testicular volume.