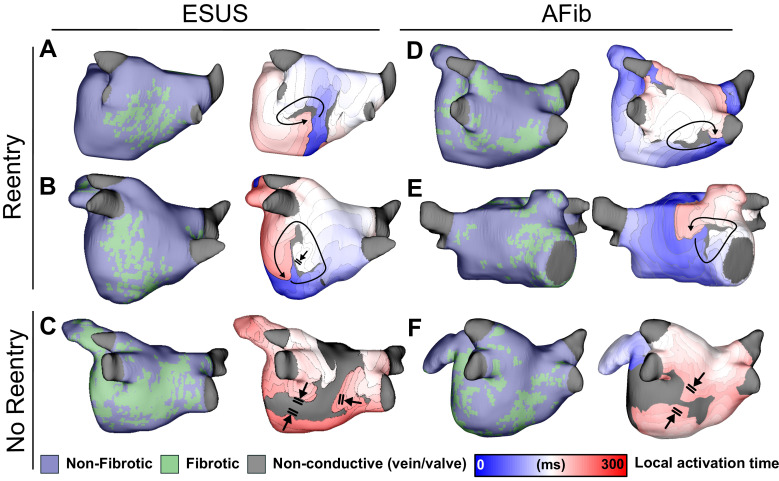
Figure 4. Maps of fibrotic tissue distribution (left) and activation time (right) for ESUS and AFib models in which pacing succeeded (rows 1–2) or failed (row 3) to induce RD-driven arrhythmia.
Black arrows indicate directions of wavefront propagation in RDs. Double lines indicate sites of conduction block. Black-shaded regions in activation maps indicate locations where activation did not occur during the analysis interval. (A) ESUS model with 6.9% fibrosis and reentry inferior to LIPV. (B) ESUS model with 10.0% fibrosis and reentry on the atrial floor. (C) ESUS model with 16% fibrosis with wavefront termination through fibrosis on posterior wall. (D) AFib model with 9.9% fibrosis and reentry observed adjacent to RIPV on posterior wall. (E) AFib model with 13.7% fibrosis and reentry observed on the anterior wall. (F) AFib model with 11.6% fibrosis with wavefront collision on posterior wall.

